Multidimensional cavitation monitoring update
29 October 2004There is much more to cavitation monitoring than reading total cavitation intensity. Using a case of two 48MW Francis turbines, Branko Bajic illustrates the diagnostic details delivered by the multidimensional technique, compares it to simpler approaches, and contrasts the roles of model tests and in-plant cavitation monitoring
In two earlier papers published in IWP&DC, an innovative approach to diagnostics and monitoring of turbine cavitation was introduced, first for a high [1] and then for a low [2] number of runner blades. This multidimensional approach is based on a detailed study of sensors and signal and data processing problems [3] and the specific theory [4]. The application examples presented in references 1-6 show that the approach is efficient both as a diagnostic tool and as a means for highly sensitive monitoring. The advantages of multidimensional cavitation monitoring over simpler systems is that it delivers almost as detailed a description of cavitation as imaginable and thus enables:
• recognition of different cavitation mechanisms (different types of cavitation or the same type appearing in different locations);
• assessment of the role played by turbine parts in cavitation;
• estimation of the spatial distribution of cavitation in the turbine; and
• achievement of extremely high sensitivity in detecting changes in turbine cavitation performance and the onset of detrimental effects.
In this paper, typical results of multidimensional cavitation monitoring are reviewed, a simple implementation of such a monitor is illustrated (related to the one for the multidimensional hydro-unit general monitor, presented in reference 7), and the results of the multidimensional cavitation monitoring are contrasted with those of a simple cavitation monitor and with model test results.
Turbine cavitation characteristics
The multidimensional cavitation characteristics of a turbine [4], which are included in the monitoring algorithm of the multidimensional cavitation monitor and used in the diagnostic tests, are defined in Table 1. With respect to cavitation mechanisms, each of these characteristics can be defined for:
• the total cavitation in the turbine,
• each cavitation mechanism separately, or
• the erosive mechanism or the group of erosive mechanisms.
The calibration of the characteristics can be:
• relative, with an arbitrary reference, or
• absolute, in kg of the metal mass lost in a specified time interval (e.g. 10,000hr) while the turbine is being operated in the operation point considered.
An example
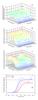
The characteristics defined above, as obtained by detailed cavitation monitoring, are illustrated by the example of two 48MW vertical Francis turbines in a plant operated at an almost constant head and rather constant tail water level. The turbines differ slightly in the runners but all other parts are the same. They have 20 guide vanes (v in Table 1) and 17 runner blades (b in Table 1). Figure 1 presents four types of the characteristics; turbine A is considered in all of them, and in the global characteristic (figure 1d), turbine B is also shown. The set of the operation parameters P is reduced to the power.
Four cavitation mechanisms are found by monitoring the two turbines considered: areal cavitation on the suction side of the runner blades; leading edge cavitation; areal cavitation which disappears in free water downstream from the blade; and cavitation in the free vortices in the draft tube. The first three, which are related to the runner, are shown in figure 2. Among them, only the first mechanism proved to be erosive. The global characteristics (figure 1d) are given for the erosive mechanisms and for the sum of all the mechanisms.
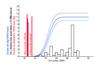
In figures 1 and 2, relative calibration of the cavitation intensity is applied. All the values are expressed as percentages of the intensity of the erosive mechanism in Unit A at 48MW. Such a way of presenting the intensities is useful for comparing turbines (as in figure 1d) or for assessing the share of turbine parts in the total cavitation intensity. In figure 3, the absolute calibration yielding metal loss in unit time is used. In the case shown, the weight in kg of electrodes needed for repair is used as a measure of this loss, instead of the kg of the runner body itself. By combining the absolutely calibrated global characteristic (which thus yields the erosion rate for each operation point of interest) and the turbine operation statistics (presented in figure 3 by the probability density of various power settings), the erosion accumulated in a chosen time interval can be derived. This can be done on historical data while analysing the role of various operation regimes or optimising the maintenance schedule, or on assumed operation statistics, while planning the optimal operation schedule.
Implementation
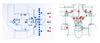
Use of a rather large number of sensors is characteristic for the multidimensional monitor (see figure 4); four, six or eight per turbine are typical. The sensors are mounted on various places on the dry side of a turbine, in a way to sense structure-born sound generated in turbine metal parts by cavitation. For an unbiased assessment of cavitation intensity, the entire energy of cavitation noise must be taken into account. To pick it up, and also to enable sufficiently high resolution with respect to the instantaneous angular position of the runner, fast-reacting, broad-band sensors (up to 1MHz) must be used. Their response is made free of side effects and independent of the influence of mounting details by means of a spectrum normalisation technique [8] and a specially devised in-situ calibration procedure.
A computer used as a processor in the cavitation monitor reduces a large quantity of high-frequency data into a small set of scalar and vector data which represents the intensities according to the four types of cavitation characteristics. While this output data is similar to data used to monitor other dynamic processes in hydro units, the large quantity and high rate of input cavitation signals and the processing speed needed to process it in quasi real time, make cavitation processor different from the processors used in the general monitors.
The multidimensional cavitation monitoring system can be designed:
• as a stand-alone unit incorporating the operator interface,
• as a passive, separate system that reduces cavitation signals to data on cavitation and delivers this to the general plant monitoring system; or
• as an integrated monitoring system that monitors all the quantities needed, including cavitation. Here the processing power needed for cavitation usually suffices for all the functions of the general monitor.
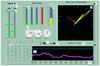
The operator interface does not depend on the implementation variant. On users' screens (on the monitor itself or on the users' PC) the cavitation data can be presented either:
• independently, in a manner illustrated in figure 5; or
• incorporated into the set of all monitored data, in the way shown in reference 7.
Simple vs. Multidimensional cavitation monitor
The characteristics of simple and multidimensional cavitation monitoring are contrasted in table 2.
Monitoring vs. model tests
• There are strong scale effects in incipient cavitation modelling [9]. Thus, it is advisable to control cavitation on the prototype, e.g. in the acceptance test. The monitor or a diagnostic test is needed for this.
• Turbine cavitation performance varies in time, making continuous control necessary.
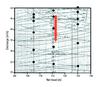
• In a typical model cavitation test, much less useful data for practical operation of the prototype is obtained than by means of an in-plant multidimensional vibro-acoustic monitor (see figure 6).
• In some cases, not all types of cavitation can be seen in a model test. All can be heard and assessed in a good, multi-dimensional in-plant vibro-acoustic test.
Conclusion
The multidimensional cavitation monitor delivers detailed diagnostic data and reliable estimates of cavitation intensity. It detects detrimental effects with a very high sensitivity. An introductory diagnostic test is needed in order to design the multidimensional cavitation monitor for a given turbine. The cavitation monitor can be implemented as a stand-alone unit, a passive system connected to the general plant monitor, or integrated into the general monitor.
Author Info:
Dr Brank Bajic is managing director of Korto Cavitation Services
| Figure 1 |
| Figure 1: Turbine cavitation characteristics |
| (a) Detailed cavitation characteristic consists, in the case being considered, of 20 graphs like this, one for each guide vane. The characteristic describes both the cavitation quality of a runner blade and the severity of the flow distortion caused by a guide vane. This is the most detailed description of the turbine's cavitation behaviour. It can be used to make a diagnosis of the cavitation and to decide if an improvement is necessary and possible. In this particular case, the turbine parts' quality is rather uniform. |
| Figure 2 |
| Figure 2 |
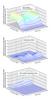
| Well-interpreted rich data on cavitation delivered by multidimensional monitoring enables recognition of the cavitation mechanisms and their quantitative assessment. In these three graphs the result of such a procedure is presented. The wicket-gate characteristic format is used to present three components of the total intensity, which stem from three cavitation mechanisms found in the vicinity of the runners in the turbines considered. |
| Figure 3 |
| Figure 3 |
| Absolutely calibrated global cavitation characteristic yields erosion rate for different operation conditions. The uncertainty bounds for the erosion rate and the accumulated erosion estimate are also drawn here. |
| Figure 4 |
| Figure 4: Examples of sensory systems |
| A large number of sensors is used in a cavitation diagnostic test (blue and red dots). Only a part of them is used for permanent monitoring of cavitation (red dots). The other dots at the bulb unit denote various other sensors used in the general monitoring system. |
| Figure 5 |
| Figure 5: An example of a display in a multidimensional cavitation monitoring system |
| One monitoring system can serve one or more turbines. The results for different turbines can be displayed independently or on a common display. Here, the former is adopted (1). Relevant operation data, such as head and tail water levels (2), and efficiency and power data (8) are presented in addition to the data on cavitation. Cavitation intensity is presented for each of the runner blades (3) - four of them in the example shown - and for the entire turbine (4). For each of the blades and for the whole turbine, the circumferential distribution of intensity over the guide vanes (5) is shown; this can be made in two different resolution grades (13). Behind the outputs shown, there are multidimensional algorithms implementing the cavitation characteristics discussed above: (3) - runner characteristic, (4) - global characteristic, (5) - detailed and wicket-gate characteristics. The numerical results can be followed in a log (10), the content (9) and the length (14) of which can be varied. Also, the content of the polar display (5) can be selected (7). Both the polar diagram and the log can be enlarged (6). The command (11) opens further windows. Among others, these incorporate accumulated erosion, the display of cavitation intensities over the operation parameters and over the shell diagram. The operators need not know much in advance: simple on-line help is available (12). Behind all this, there is an Intranet connection to the general monitoring system of the plant, the PC's of the plant staff, and other plants in the chain, if applicable. All data are delivered to the control system and so are the alarms. There, they and the intensity data can be used for operation optimisation. |
| Figure 6 |
| Figure 6 |
| Log of the model tests of the turbines used here as the example: the black dots stand for model tests and the red dots for the multidimensional monitoring results. The latter cover the whole range of a normal operation. Thus, the monitoring delivers detailed data as illustrated, while only two model points are directly useful in practice. |