Optimum solution for diversion tunnels
13 February 2007Saied Saiedi presents the results of research on the optimum diameter of diversion tunnels in dam construction
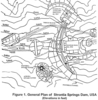
Despite concerns raised in developed countries over the environmental impacts of large dams (WCD 2000), numerous large dams are still being planned or built in the world, especially in developing countries. For example, there were 44 major dams higher than 60m under construction in Japan in 2001 (JCOLD 2004), 45 dams are being planned or constructed in Malaysia compared to its total 71 existing dams (MWA 2003), and 58 large dams (height >15m) are being built in Iran compared to its total 56 existing large dams (IRCOLD 2004). Construction of dams may take up to 10 or more years. In this period, the river water has to be diverted away from the dam site so that the construction of the dam can be undertaken in the dry. The usual method of river flow diversion involves construction of tunnels and cofferdams. The tunnel is excavated in either of the abutments to divert the entire river flow, both its usual and flood discharges, around the dam site. The cofferdams are watertight structures, usually earthen embankments, constructed upstream and downstream of the site to isolate the construction area that is to be kept dry. The tunnel entrance is upstream of the upstream cofferdam and discharges into the river downstream of the downstream cofferdam. Figure 1 shows the general plan of Strontia Springs dam in the US, and layout of its diversion system.
Occasionally, some future use may be made of the diversion structures such as incorporation of part of the tunnel into the outlet or spillway systems, or inclusion of the upstream cofferdam into the upstream section of the main body of embankment (earthfill or rockfill) dams. However, once the dam is completed, the diversion works are mostly discarded partly or completely. The diversion tunnels are carefully plugged and deserted. The upstream cofferdams, particularly in the case of concrete dams, will be removed in order not to impair the full utility of the dam reservoir or the operation of the dam structures.
The cost of diversion works depends, among other factors, on: the tunnel dimensions and the intended tunnelling support measures during and after excavation; quality and specifications of the rock through which the tunnel should be excavated; the dimensions of the upstream (and downstream) cofferdams; and the magnitude of river flood the system is designed to divert. In a given project, most of these factors are effectively invariant: tunnel length depends on the geometry of the valley and the dam; upstream cofferdam length depends on the width of the valley upstream of the dam; the side slopes of the cofferdams are usually between 2 to 2.5 horizontal to 1 vertical; the design flood depends on the river flow regime and on the level of risk adopted by the engineer in flood frequency and hydrological analysis; the downstream cofferdam height depends on the depth of the design flow along the river once out of the tunnel; the usual pre-cofferdam dimensions are quite independent of the other diversion works; and the tunnel portals (reinforced concrete [RC] structures at the inlet of the tunnel to provide for a stable and smooth entrance) are necessary for most cases regardless of the tunnel size. Apart from these fixed factors, two factors are subject to change by the designer: tunnel diameter (D) and upstream cofferdam height. Depending on the project specifications and on the designer choice, D and upstream cofferdam height could be as large as 15m and 90m, respectively. Cooke (1984) reported on Areia dam with its 93m high cofferdam and Cai et. al (2000) discussed orifices installed in the 14.5m diameter diversion tunnels of XiaoLangDi hydro project on the Yellow river in China.
Theoretically, one may choose a very large diameter tunnel capable of carrying the largest flood predicted for the given return period leading to a small cofferdam height, only enough to form a barrier to the river. Alternatively, one may theoretically design a very high upstream cofferdam providing sufficient head to carry the predicted flood through a tunnel of very small diameter. Practical considerations aside, both these extreme designs serve the purpose of diverting the design flood. In the first case, the cost of the tunnel will be large and that of the cofferdam will be small, while it is the opposite in the second case. Between these two extreme cases, there lie numerous possible combinations of tunnel diameter and cofferdam height, from which the best practical combination entailing the least cost should be sought. Given the fact that the cost of diversion works could be as high as 10-20% of the total dam construction cost, due attention should be paid to optimum design of the diversion works.
Basic assumptions and limitations
Table 1 contains the summary of the basic assumptions employed in this study necessary to attain guides on the optimum tunnel diameter and cofferdam height in dam diversion works. The assumptions are classified as follows.
Geometric assumptions
The average side slope of the upstream cofferdam is considered 1 vertical to 2.25 horizontal, as the typical values are 1 to 2.5 and 1 to 2 for the upstream and downstream faces, respectively. The top width of the cofferdam is assumed to be 5m. The cofferdam length is the same as the valley width at the respective river section. This width is fixed for a given cofferdam height. If the maximum hydrostatic head of the water accumulated behind the cofferdam measured above the tunnel invert is H, then the cofferdam height is H plus the freeboard, F. The freeboard, defined as the vertical distance between the maximum water surface elevation and the cofferdam crest elevation, allows for safety against cofferdam overtopping. This freeboard is considered to be 1.5m here. The work by Wilson and Marsal (1979) contains valuable guidance in the design and construction of cofferdams for large dams.
The tunnel length L depends on the extent of the site needed to remain dry and is typically a few tens of meters more than the base width of the dam. It is generally greater for embankment dams than for concrete dams. In any given project, L is fairly fixed and is not subject to optimization here. The tunnel longitudinal slope, S, has no typical value as it depends on the geometry of the river and the valley but generally is of the order of the riverbed slope at the site. The effect of the slope is to add LxS to H. Therefore, if the slope increases, the discharge capacity of the tunnel increases and the required cofferdam height decreases. When S is significantly different from the average value assumed in Table 1, the effect on the cofferdam height estimated from guides presented in this study should be accounted for. A circular diameter (D) of the tunnel is used to represent and compute the tunnel cross-sectional area available for the flow. In the case of the horseshoe section, the equivalent circular section should be employed. In the optimization attempt, D and H are inter-related and vary together. Greater H requires smaller D and vice versa.
Tunnel support types
Tunnel excavation includes surveying, drilling (and blasting in the drill and blast method), mucking, drainage, ventilation and lighting. Immediately after excavation of each longitudinal segment of the tunnel, support measures for the exposed area of the tunnel are required to various degrees. The typical support measures are stabilisation of the tunnel by firstly installing rock bolts into the rock, grouting cement mixtures to fill the gaps, the fissures and the drilled holes around the bolts, and secondly placing a shotcrete layer containing a mesh of steel wires (diameter ˜ 5mm). However, depending on the ground stresses, other support measures such as steel ribs, timber lagging, dowels, etc may be required in some locations along the tunnel. To provide for better stability, more durable surface and smoother flow conduit, the water carrying tunnels are often lined with formed reinforced concrete about 0.3m to 0.75m thick depending on the tunnel diameter and rock quality. This shotcrete and the RC lining are called Support Type I here. When dealing with a better quality rock and intending to save on support cost, RC lining may be avoided. This is called Support Type II involving rock bolts, grouting and shotcrete only. In some rare cases, the rock is so competent that little support (i.e., only local and scattered rock bolting and shotcreting) is regarded sufficient and water is allowed to flow through the tunnel along the natural rock surfaces (Support Type III). An example of tunnels with no rock support is Walgau Tunnel in the power plant scheme of Walgauwerk in Austria.
Hydraulic assumptions
With a design flood significantly larger than the average river flow, water flows full in the tunnel, similar to a pressurised culvert flow with the free exit (not submerged). This happens when H/D > 1.2~1.5. The whole available head will be used up by three losses: the entrance loss at the tunnel inlet, friction loss along the tunnel surface, and the exit loss at the tunnel outlet. The first and the third can be represented by CL3V2/2g where CL is the loss coefficient (equal to a conservative value 0.5 for the entrance and 1 for the exit) and V is the flow velocity. The second involves a roughness coefficient such as Manning's n. Manning's roughness coefficient n is assumed equal to 0.14, 0.022, and 0.030 for the tunnel Support Types I, II, and III, respectively, as defined in Table 1.
Hydrological considerations
The most important factor determining the final values of D and H is the design diversion discharge, Q. This discharge comes from hydrological analysis of the river flow and, in particular, from the flood frequency analysis. The respective return period is chosen in view of the hazards involved. A more conservative design flood (i.e., a higher return period) has to be considered for situations where overtopping during construction would have disastrous results. The return period may be 5, 10, 20, 50, 100 years or even higher, depending on the river flow regime and the project importance. For example, one of the cofferdams with least known chance of overtopping was the main cofferdam at Areia dam (Cooke 1984) that was designed to prevent overtopping by a 500-year return period.
Cost assumptions
To attain a simple mathematical framework for the optimisation, unit prices of tunnelling and cofferdam works should be used. Engineers routinely make this use in preliminary cost estimation of the civil projects in the reconnaissance phase of the design. The unit prices, the range of which is contained in Table 1, reflect overall in all factors influencing the price of each item.
The question of the optimum diameter is inseparable from the cost of works involved in the diversion. For example, if for any reason the price of tunnel excavation is very high and the price of embankment construction is relatively low, the design tends towards smaller D and larger H. Apart from obvious dependency of the prices on the overall economical situation of the country, the cost of civil works has much to do with specifications of the project such as the locality and topography, availability of the required materials and equipment, quality of the soil and the rock, the execution methods adopted by the contractor, and un-anticipated situations regarding water, weather and ground, among other factors.
A wide range of various practical unit prices is included in the present study to examine the dependency or otherwise of the results on the price levels. Table 1 shows the price ranges. The lower limits relate to the developing countries while the upper limits are likely to apply in developed countries. For an excellent but rare price documentation of diversion works among other dam and tunnelling works, see USBR (1983). A few points are worthy of mention: (i) Numerous combinations of prices within the above-mentioned ranges have been tried in this study. However, the core of the trial prices can be categorised in Class 1 and 2 for cofferdam embankment fill (2 and 4 US$/m3, respectively, as average for impervious and rockfill materials) and nine different scenarios for the set of prices for tunnel excavation, tunnel support, and reinforced concrete lining. These scenarios are clearly stated in Figure 9; (ii) The prices are direct prices and do not include costs such as mobilization, overhead, insurance, etc. The difference, represented by a constant multiplier (of the order of 1.4 to 2.0), has no effect on the optimization results; (iii) The costs such as those related to pre-cofferdam, downstream cofferdam, open-cut excavations and portals at the tunnel ends are not included in the total diversion cost in this study. They do not affect optimisation results, as they are almost independent of D.
Limitations
In addition to the limitations inherent in all the above assumptions, two limitations of the present study are worthy of mention. They relate to the preferences imposed by time or equipment considerations. In some projects, the cofferdam must be constructed hurriedly in low flow period and the failure of a larger cofferdam brings about higher risks to downstream properties or lives. Therefore, the diversion works may tend towards a larger tunnel and smaller cofferdam. In some developing countries where the government clients (such as the dam or irrigation authorities) employ their own contractors or heavy equipment, the availability of some particular equipment (in particular tunnel boring machines [TBM]) may effectively limit the number of viable alternatives for the diversion works. Inclusion of these constraints into the optimization of the diversion works will be dealt with in the later stages of this research.
Mathematical description
Let C1 (US$/m3), C2 (US$/m3), C3 (US$/m2) and C4 (US$/m3) be the unit prices for tunnel excavation, tunnel lining, tunnel support (rock bolt + shotcrete) and cofferdam fill, respectively. Denoting the respective amount of works by V1 (m3), V2 (m3), V3 (m2) and V4 (m3), in the same order, it follows that
V1 = 0.785L[D + 2(T+0.1)]2 (1)
V2 = 3.14LT(D + T)(2)
V3 = 3.14L(D+2T)(3)
V4 = W[B + 0.5 (zu + zd) (H + F)](H + F)(4)
H = [1+k+2gn2L/(0.25D)1.333] Q2 / [2g(0.785D2)2 ] - LS+ 0.5D(5)
where L(m) is the tunnel length, D(m) is the tunnel final diameter, T(m) is the lining thickness, W(m) is the average upstream cofferdam length, B(m) is the cofferdam top width, zu(-) and zd(-) are the upstream and downstream side slopes of the cofferdam section respectively, H(m) is the head of the water above the tunnel invert, F(m) is the cofferdam freeboard, k(-) is the tunnel entrance loss coefficient, g(m/s2) is the gravitational acceleration, n(s/m1/3) is the Manning's roughness coefficient, Q(m3/s) is the design diversion discharge, and S(-) is the longitudinal slope of the tunnel. Note that Equation 5 is the mathematical form of a simple hydraulic statement that the total available head (H+LxS-0.5D) is used to overcome three losses mentioned in 'Hydraulic Assumptions' above (also see USBR 1987 for a full account of hydraulics of such tunnels). The losses relate to the entrance, the friction along the tunnel surface, and the exit. The objective function then becomes
Total Diversion Cost CT = C1 V1 + C2 V2 + C3 V3 + C4 V4 (6)
Simplified solution
Noting that T is assumed to vary linearly with D (see Table 1), V1 to V3 are all functions of D to the first or second degree while V4 is mainly a function of H. Accepting some degree of approximation for the tunnelling cost Ct (excavation, support and lining) and cofferdam cost Cc, one may write Ct˜a1LD2 and Cc˜a2WH2 . Because the freeboard F is relatively small compared to the cofferdam height, it is feasible to regard H as approximate cofferdam height. Hence,
CT ˜ a1LD2 + a2WH2 (7)
H ˜ a3LD-5.33Q2 (8)
dH/dD ˜ a4LD-6.33Q2 (9)
where a1, a2 , a3 and a4 are constants. CT does not have any maximum because there is no theoretical limit to D or H, and CT in Equation 7 is increasable to any large number. Therefore, solving dCT/dD=0 will result in a D corresponding to the minimum of CT.
dCT/dD = 2a1LD + 2a2WH dH/dD = 0 (10)
Substituting (9) in (10) leads to
Dopt ˜ a5(WL)0.08 Q0.32 (11)
in which a5 is a constant and Dopt is the tunnel optimum diameter. As W and L are fairly constant in a given project, then
Dopt ˜ a6 Q0.32 (12)
with a6 being a constant depending on many parameters including W and L. Equation 12 implies that Dopt is approximately proportional to Q0.32.
Minimisation for the whole data range
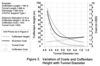
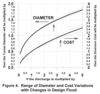
Minimisation of Equation 6 in view of Equations 1 to 5 under the constraint H/D>1.2 for any set of given fixed parameters using any optimisation technique will lead to Dopt. This was performed for the whole range of the data mentioned in Table 1 and variations of D (and H) were carefully examined. Sample results are presented in Figures 2 and 3. The figures are presented in a self-explanatory form. A few general points, however, will be noted below.
Sensitivity studies
Sensitivity to overall price levels
In no case was there any significant difference in the results for Dopt or Hopt when all unit prices changed with the same proportion. It means, as long as the price ratios are maintained approximately the same, one should expect effectively the same Dopt or Hopt for any given set of geometric, hydraulic and hydrologic data regardless of the overall price levels in the country. A quick look at the simplified form of the solution, starting from Equation 7 and leading to Equation 12, provides evidence.
Sensitivity to relative price levels
The solution may present significant sensitivity to the relative price levels of the works particularly for projects involving narrow valleys (small W) and long tunnels (large L). This sensitivity diminishes for higher values of W/L ratio (W/L>0.5).
Sensitivity to geometry and support type
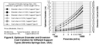
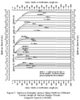
Cases with smaller W/L ratio show more sensitivity to relative variation of the unit prices. As W becomes larger, the sensitivity of the solution to L becomes negligible for Support Type I (involving RC lining) while it becomes more pronounced for Support Types II and III. The difference being in lining, this is because RC lining forms a significant portion of the total diversion cost in most projects. For a given project, Dopt is smallest for Support Type I and the largest for Support type III. This holds true regardless of the design flood, prices and the geometry. The type of support, leading to different roughness coefficients of the tunnel, would always make a distinct difference in both the resulting Dopt and the costs (See Figures 2 and 5-9). It is interesting to note from Figure 3 that in some cases, a 10% change in D (changing D=4.5m to D=5m, for example) may cause a significant change in the total diversion cost (up to 40%).
Generalised guides
Fitted formulas
Numerous curve fittings applied to plots of Dopt and the total diversion costs versus Q (such as those in Figures 2 and 8) for all combinations of unit prices in the ranges mentioned in Table 1 led to the following relations in which a7 and a8 are some constants:
Dopt=a7 Q0.35 to 0.40 (13)
Cost =a8 Q0.52 to 0.62 (14)
Given the complications involved in the exact solution to Equation 6, the deviation of the power in Equation 13 from that obtained in Equation 12 is both expected and insignificant. The respective mid-curves are now introduced for such practical evaluation:
Dopt ~ Q0.37 (15)
Cost ~ Q0.57 (16)
in which ~ denotes the proportionality. These curves are depicted in figure 4. Equation 6 is a complicated function of D defying any analytical solution. However, a further step from simplified relations 15 and 16 towards better estimation can be taken by multi-regression statistical analysis of the results in the whole ranges mentioned in Table 1.
Fitted curves
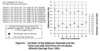
Adopting moderate unit prices with the typical parameters listed in Table 1, graphical representation of the results led to Figures 5, 6 and 7 corresponding to Support Types I, II and III, respectively. These curves should be used as rough guides providing for the first approximation to Dopt. Involvement of many geometric, hydraulic and price parameters does not allow any analytical interpretation of the behavior of the curves except for those similar to what is inferred and stated in the above paragraphs on the sensitivity of the solution. These curves indicate that: (i) When the valley is narrow, a higher cofferdam (i.e., larger H, associated with smaller D) is proffered. For wide valleys, larger tunnels (i.e., larger D, associated with smaller H) are preferred because an increase in H leads to significant overall cost increase. However, if the valley is very wide (W greater than 600 or 700m for Support Type I, and greater than 200 or 300m for support Types II and III), the growth of D stops at a limit and the curves become horizontal. (ii) Longer tunnels are generally associated with smaller Dopt regardless of Q and W and the support type. When the tunnel is very long, an overly large tunnel must be avoided and heightening of the cofferdam should be examined instead. It has been observed by this investigator that some who follow the tradition of determining D only by Q and W often overlook the simple fact of dependency of Dopt on L.
Multiple diversion tunnels
For at least two reasons, the designer may choose multiple (mostly twin) tunnels to carry a large design flood: (i) large cross-section needed to divert large flood is associated with specific problems such as higher tunnel stability risks and expensive support measures, need for more complicated excavation or support equipment, and more risks brought about for the abutments specially when the overburden or the rock quality is not sufficient; (ii) the design flood may not happen during construction and the discharge in a great majority of construction days is much below the design flood. Therefore, twin tunnels may be constructed, one to carry the usual low and average discharges, another with a higher invert elevation to carry the additional part of the design flood. When the second one is constructed sufficiently higher than the first, it may be mostly used as access road tunnel between upstream and downstream parts of the dam during construction (such is the case in Seymareh dam, a double arch 180m high concrete dam under construction in southwest of Iran). The designer may choose to apply support but avoid RC lining in the second tunnel (such is the diversion tunnel No. 2 in the ongoing Mohale dam in the Lesotho Highlands water project, 6.7m unlined as opposed to the first tunnel with excavated/line diameters of 5.6/5m).
Findings of the present study can be employed to examine the effect of multiple tunnels in diversion works. The design discharge is effectively divided to pass through different tunnels. For each new discharge, specific plots such as those in Figure 4 should be used to estimate the effects on the diameter and the cost. The designer can then readily compare the advantages or otherwise of multiple tunnels in the context of the overall dam project.
A case study
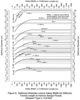
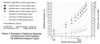
The diversion system of Strontia Springs dam in the US, shown in Figure 1, is chosen to apply some of the findings of the present study. The dam is a 70m high and 150m long double arch concrete dam, built across South Platte river. The upstream embankment cofferdam is 40m long and 9m high. The diversion tunnel has 207m length and 4.6m diameter on 2.1% longitudinal slope (more drawings of the dam are given in Saiedi 2002). Figures 8 and 9 show the results of the optimization by this writer using the same typical unit prices. From Equation 5 with the given tunnel and cofferdam, the carrying capacity of the diversion system was found to be 160m3/sec. This discharge was then used to find Dopt for W=40 m, L=207 m and S=0.021 for various pricing scenarios. Figure 9 shows the results, indicating the choice of the design engineer was fairly close to Dopt.
Conclusions
• Mathematical framework for optimisation of the tunnel diameter (and the upstream cofferdam height) in diversion works of dam construction is presented.
• A rule-of-thumb guide is derived mathematically and presented in Equation 12 for a preliminary estimation of the effect of design floods on the optimum diameter Dopt of the diversion tunnel.
• Applying the optimisation procedure to a wide range of geometric, hydraulic and price factors, Equation 12 was verified and adjusted for more practical usage. The guide was also extended to cover estimation of the total diversion cost variation with Q. Figure 4 and the corresponding relations 15 and 16 reflect such practical guides.
• Curves are introduced in Figures 5 to 7 for estimation of Dopt, for moderate unit prices as defined in the caption of Figure 2, in terms of the tunnel length, cofferdam length (valley width), tunnel support type and Q. A case study, concerning typical diversion works of a dam in the US, supported the applicability of the findings.
• It is shown that the findings of this study can be used to consider multiple diversion tunnels as alternatives to a single tunnel.
• Considerable amount of material can be found in the literature on the execution and design of individual parts of the diversion works (see Jansen 1988 as an example) but little discussion on the best dimensions for the tunnel diameter and the cofferdam height is presented. This is partly because in failures of the diversion tunnels or overtopping of the cofferdams, the attentions can be directed towards the readily available 'justifications' provided by 'unpredictable hydrological factors'. This lack of due attention can also be attributed partly to the fact that the diversion works are not dealt with elaborately by the design engineer and are mostly regarded the responsibility of the contractor, an engineering body traditionally regarded to care more for execution than for theoretical studies such as the present investigation. However, considering the fact that in the whole work structure, the contractor deals more specifically with 'material' and financial issues, a closer attention to the financial implications and savings of the present findings is recommended.
Author Info:
Saied Saiedi, Associate Professor, Ph.D, Civil Engineering Dept., University Technology Petronas, 31750 Tronoh, Oerak, Malaysia. Email: saiedsaiedi@petronas.com.my.
Acknowledgements - The reviewer of International Water Power and Dam Construction has drawn the author's attention to the limitation of the study in inclusion of the risks associated with the cofferdam failure as highlighted in a paragraph under 'Basic Assumptions and Limitations'. This contribution and comments on the significance of the present search for the optimum diameter of the diversion tunnel are warmly appreciated.
The author has also benefited from ample time and facilities provided by the UTP management during the course of this study.
| Notation |
| a1 to a8 = coefficients |