Rain, floods, and dam safety
7 July 2010A new assessment of extreme rainfall has recently been published by DEFRA in the UK. In this paper, Colin Clark raises some concerns about the revised methodology used in the report
Following the discovery that FEH (IOH, 1999) 1 in 10000 year rainfall exceeded FSR (NERC, 1975) probable maximum precipitation (PMP) at certain sites in the UK (MacDonald and Scott, 2000; Babtie Group, 2000), a new assessment of extreme rainfall has recently been published (Defra, In Press). The new results show a reduction in 24 hour 1 in 10000 year rainfall of up to nearly 200mm at some sites. For 6-hour 1 in 10000 year rainfall the reductions are often in excess of 150mm. Smaller reductions are suggested for 1000 year and 100 year rainfall depths.
In this paper I report on several concerns about the revised methodology used in the Defra (In Press) report, and provide a specific test of the revised rainfall estimates. The results show that the depth of flood producing rainfall has been substantially underestimated. Furthermore, several notable rainfall records have been omitted from the analysis, including the largest recorded rainfall in the UK. Another problem is the inadequate raingauge network in certain areas, a shortcoming that has not been compensated for in the analysis.
New estimates of PMP are not presented in the Defra report, which could, given a suitable rarity, have allowed the merging of T-year rainfall estimates with estimates of PMP. I also present a review of estimates of PMP and how they can be merged with standard rainfall frequency analysis. The result is then applied in the estimation of flood rarity for seven well documented extreme floods in the UK, via a joint probability model based upon effective rainfall (rainfall–soil moisture deficit, SMD) and SMD. The implications for dam safety are described. The revised estimates of 2–106 year rainfall will form part of a New Guide to Flood Estimation in England and Wales.
The station year method of rainfall analysis and the ergodic hypothesis
The agglomeration of rainfall records from either all raingauge sites (NERC, 1975), or those gauges that are assessed as being independent, (Dales and Reed, 1989), are examples of sampling in space as a substitute for sampling in time. For example 50 independent records each with 30 years’ observations produces 1500 station years’ of data. With a large data set the possibility of making estimates of rainfall with high return periods becomes attractive. Substitution of space for time is a variation on the ergodic hypothesis – a term borrowed from physical mechanics. It is a potentially very powerful way of providing answers to difficult questions especially where long time periods are involved. For example the degradation of a marine cliff in South Wales through time that was progressively protected from erosion by an advancing sandbar, was demonstrated by Savigear (1952). Similarly, Ruhe (1952) showed the evolution of a drainage network in central US because it was possible to date the age of different areas since the ice retreated, based on the age of till deposits over the last 50000 years: as time progressed drainage density increased rapidly at first and then slowed down. As the ice retreated from Glacier Bay in Alaska during the 19th century, changes in the soil and vegetation were identified by Crocker and Major (1955). In all of these studies the time dimension is clearly apparent, although the influence of differences in solid and drift geology should be taken into account.
In the case of rainfall analysis the time dimension is the time span over which the records were gathered. This length of time is about 100 years: any extension of the estimates of rainfall to higher return periods cannot be made unless a method of extrapolation is used or estimates of the upper limit of rainfall depth – PMP – are made. The latter approach also requires an estimate of the rarity of PMP. Thus the ergodic hypothesis cannot be applied to rainfall frequency analysis. In none of Emil Gumbel’s papers (Gumbel, 1941a, b) or his classic monograph (Gumbel, 1958) are predictions made of events whose return period exceeds 1000 years. But the problem facing the dam engineer is that events can and do take place whose rarity is much greater. Hence the problem reduces to producing a method that gives realistic estimates of rainfall depth up to the probable maximum. Before this is considered further the question of missing data must be considered.
Omission of historic storm data
One of the objectives of the Defra (In Press) report was to assemble all the available data on extreme events since this would give the best chance of estimating the depth of very rare storms. As part of this process (Svensson et al, 2009) have produced a useful list of events, noting at the same time that five events have exceeded FSR PMP. These are listed in Table 1.
The lower part of Table 1 shows the corrected depth and duration where appropriate for three of the events. In the case of the Bruton storm the contemporary newspaper reports all suggest a storm duration of about 12 hours; the Hardy Monument reading was collected by Ian Forbes (Clark, 2005a); while the Horncastle event was a simple mistake in copying the storm depth at Horncastle whose duration was six hours and the lower depth at Ravesby Reservoir whose duration was 2.8 hours. More serious is the complete omission of observations made during seven other events. Table 2 gives the relevant data. The most important and best documented storm event in Table 2 is the Martinstown event (Bleasdale, 1956; Clark, 2005a).
The national raingauge network and a compensation technique
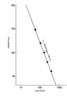
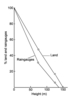
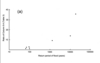
In spite of the dense raingauge network of about 4000 stations in the UK, there are areas that do not have the recommended raingauge density as per Shaw (1989), and Raghunath, (2006) of one gauge per 26km-2 and one gauge per 37km2 respectively. For example in an area of 971km2 in East Yorkshire only 6% of the gauges cover 16% of the land area (Figure 1). This is equivalent to a gauge density of one per 156km2. This particular area is above 100m OD where the highest storm rainfall is likely to occur. A good example of this is the Louth storm of 29 May 1920 (Arellano and Clark, 2004), where Figure 2 shows the depth area relations for this storm, a result that implies a rainfall of 232mm covering an area of 10km2. If this took place in about three hours then the new FEH rainfall estimates in Defra (In Press) give it a return period in excess of 106 years.
In order to compensate for an inadequate raingauge network in India Rakhecha and Clark (1999) carried out depth area analysis to estimate rainfall at a scale of 10km2. The results were then applied in the WMO (1986) moisture maximisation procedure. This method is one of several international standards for estimating PMP. The resulting estimates of PMP (Rakhecha and Clark, 1999, 2000, 2002) have been criticised as being too high (Dhar and Nandargi, 2000). However, the previous standard estimates of PMP (IITM, 1989) were exceeded by 24cm during a storm over western India in 2005 (Kumar, et. al. 2008), so that the more recent estimates of PMP are now being used for dam safety assessments in Gujarat (RMSI, personal communication). These findings suggest that depth area analysis can help to make up for a lack of raingauges in certain circumstances, especially where the gauge density is less than 30km2 gauge-1.
The likely underestimation of maximum rainfall leads us to a consideration of estimates of PMP, together with a simple procedure for merging the results with T-year rainfall estimates.
Probable maximum precipitation
Although the concept of PMP has fallen out of favour with some dam engineers in the UK (Brown and Gosden, 2004), this should not detract from the two near miss dam incidents at Ulley and Boltby in recent years. The event at Ulley was only caused by about 100mm rainfall in just below 24 hours, while the Boltby incident was caused by rainfall well below estimates of PMP (Clark, 2008a) for this area. Therefore it was with some surprise that the Defra (In Press) report did not include a reassessment of PMP, especially as the confusion with the FEH 1 in 10000 year rainfall was partly as a result of PMP not being reassessed, and more particularly as some preliminary work on PMP for the Defra project had already been completed (Dent, 2008). The greatest uncertainty surrounds the depth of the greatest rainfall that can be reasonably be expected, hence the term probable maximum precipitation. Therefore as many methods and as much evidence as possible should be applied in order to make a realistic estimate of PMP. Similarly: “It was agreed that a combination of techniques (storm maximisation, frequency analysis, hydrodynamic modelling), and the use of local data are required to minimise uncertainty.” (Svensson, et. al. 2005).
To date the present author has used the following methods and evidence to estimate PMP.
• 1. Depth duration data from SW England (Clark, 1995), yielding 24-hour PMP of about 500mm.
• 2. Endpoint of sedimentation equation applied to rainfall data in SW England. This gave estimates of 24 hour PMP ranging from 400-550mm.
• 3. Storm maximisation using the WMO (1986) technique for historic storms, which gave estimates between 292mm for Inverness and 594mm for Seathwaite (Clark, 2002a). The same technique has been applied to the Louth storm of 1920 (Arellano and Clark, 2004) and the Cheviot Hills storm of 1893 (Clark, 2005b).
• 4. Frequency analysis of peaks over a threshold data using the modified Gumbel scale of Rakhecha and Clark (1999). Britain was divided into three regions: south, midlands, and Scotland. The results varied according to annual average rainfall as well as into three partially overlapping groups, from about 300mm in the drier parts of Scotland, increasing to about 375mm in wetter areas. For the middle and southern areas the estimate of 24 hour PMP varied from about 320mm in drier areas to 590mm where the annual average rainfall was in excess of 2000mm.
• 5. An analysis of worldwide estimates of PMP in relation to latitude (Clark, 1997) showed that in the southern part of Britain one-day PMP is about 500mm. It was later pointed out (Hardaker, personal communication) that some African countries have much lower PMP than what latitude alone would predict. This point is accepted and the simple relationship between latitude and PMP is to be regarded as an upper limit when atmospheric moisture is not a limiting factor.
• 6. Estimates of very extreme rainfall, possibly getting close to PMP have been obtained from reverse engineering of some historic floods (Clark, 1999, 2003). The results for the 1768 flood at Bruton suggest a 1 hour PMP in the range 136-190mm, while the 1898 flood at Windemere suggested a depth of about 260mm in 24 hours over a catchment area of 187km2 . By using the FEH (IOH, 1999) area reduction factor the point value was estimated as about 315mm.
These six approaches have produced estimates that are considerably higher than those in the FSR/FEH. The implication from the Defra (In Press) study is that the FSR (NERC, 1975) estimates of PMP should remain. This is in spite of a recommendation (KBR, 2003) that a new study of PMP be made, following the report to Defra by Sir David Cox (Cox, 2003). Furthermore, Dent (2008) produced estimates of PMP based on historic storms and the WMO method that are in line with those described above, and in some cases are higher.
Estimates of the return period of PMP vary from about 1 in 60,000 years (Koutsoyiannis, 2004); to 1 in 250,000 years, (Austin et. al. 1995); and 1 in 800,000 years, (Morris, 2007). From an analysis of historic floods on the upper Brue in Somerset (Clark, 1999), and frequency analyses of one-day Indian rainfall (Rakhecha & Clark, 1999), a return period of 106 years has been chosen because in both cases it was consistent with estimates of historic floods. If a value of around 8 x 10⁵ years had been chosen as suggested by Morris (2007) then very little change in the estimate of PMP or indeed PMF would be produced in both cases.
In order to obtain a 2-year to PMP rainfall frequency curve the estimate of the 2-year D-hour rainfall can be obtained from local data for a given site. Alternatively, the FEH CD-ROM can be used since the estimates are for a common event and many rainguage stations were used in their estimation. On the modified Gumbel scale the 2-year event y = 0.1891. For the PMP event taken to have a rarity of 106 years, y = 9.382. Using the Log of rainfall depth, R, and the values of y, a regression equation which links frequency and rainfall depth is established. For example if the 2-year 24 hour rainfall is 40mm and the 24 hour PMP is 475mm then the rainfall frequency equation:
Log R = 0.11689y + 1.5799 (1)
Where y = [( -ln ln (1 – 1/T - 3.3842) * 1.09348 * T –0.046518 ] + 3.3842.
This gives the depth of rainfall from a return period 2- 106 years.
Rainfall frequency and flood frequency
Because of the uncertainty of the estimates of extreme rainfall, it is essential that the results be tested for their credibility. Defra (In Press) do not provide any robust test; this may be because of a perceived lack of a standard against which the results can be assessed, but more likely because of a lack of focus on the end result, namely extreme floods. One method that was used in a general assessment of Indian PMP was to use the existing estimates (IITM, 1989) in order to estimate the probable maximum flood (Rakhecha and Clark, 1999). For sites that have a well-documented flood history, the rarity of the flood resulting from a measured storm can be estimated and then compared with the result from the flood frequency curve.
On average rare storm events will produce big floods. In volume 4 of The Flood Estimation Handbook (IOH, 1999) Table 3.1 shows the relationship between rainfall frequency and flood frequency. For common events the rainfall rarity is greater than the resulting flood frequency. When the storm rarity gets to the 1 in 1000 year event the resulting flood has the same rarity. The revitalised rainfall runoff method (Kjeldsen et. al. 2005) that largely replaces the method in the FEH, equates storm and flood return period over all event rarities. During the winter when the soil moisture deficit (SMD) is zero, this equivalence is logical, but during the summer when there can be a significant SMD the resulting flood will depend on the joint probability of SMD and the effective rainfall (Clark, 2007). Since the antecedent SMD and storm depth are uncorrelated we can write:
Rp flood = Rp SMD x Rp ER (2)
Where: Rp flood = return period of the flood, RpSMD = return period of SMD, RpER = return period of the effective rainfall, (rainfall – SMD).
The frequency relationship of SMD has been determined at Charldon Hill Research Station (CHRS) using weighing lysimeters which have been in service since 1995 (Clark, 2002b, 2007). By applying the new rainfall frequency relationships and the joint probability model to the rainfall recorded during major historic events that have resulted in a flood whose frequency can be realistically assessed, a measure of how realistic the rainfall frequency is in relation to the flood frequency, can be produced. The same procedure was also applied to the rainfall frequency used in the New Guide to flood estimation in England and Wales (Clark, 2008b). The steps in this procedure are listed below.
• 1. Use gauging station data and historic floods where available to determine a realistic flood frequency curve.
• 2. Calculate the antecedent SMD using local rainfall data and relationships between temperature and evaporation.
• 3. Obtain the area average depth and duration of rainfall.
• 4. Calculate the effective rainfall as actual rainfall – SMD.
• 5. Use the relationship ARFT = (yT1 + 1.5) exp y.s/9.382, Where ARFT = area reduction factor for the given storm rarity; yT1 + 1.5 = value of y at a given return period + 1.5 years. S = Log ARFmin / Log 9.382; y = equation 1. To determine the point rainfall depth = areal rainfall depth/ARF.
• 6. Estimate the rarity of the point rainfall using the new FEH and New Guide.
• 7. Estimate the rarity of the flood using equation 2.
• 8. Compare results with that given by the flood frequency curve.
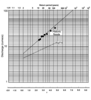
The basis for the flood frequency curves include gauging station data and historic floods in the case of the Lud at Louth (Arellano and Clark, 2004), and the Rother at Woodhouse Mill (Clark, in prep); historic floods and an estimate of the bankfull discharge for the river Brue at Bruton (Clark, 1999) and the Camel at Wenfordbridge (Clark, 2009); historic floods in the case of the Valency at Boscastle (Clark, 2006). For Withycombe Brook at Exmouth, the data of Harrison (1961) were reworked since it was found that there was a big gap in his record and that both the estimated bankfull discharge and maximum flood were unrealistic. A further check on the resulting flood frequency curve at Exmouth was made using the New Guide (Clark, 2008b) technique of estimating the median flood. The result compared well with that suggested from the flood frequency curve based on the highest five floods. The revitalised FEH method also gave a comparable value for the median flood in this case, but the growth curve was far too low (Figure 3). Table 3 shows the results for six sites and seven events for which reliable data have been obtained. There are wide differences in the estimated return period of the storm and flood using the new FEH results.
By comparing the ratios of expected and observed return periods for both methods there is a clear difference between the FFC and new FEH results, which diverge with increasing flood rarity (Figure 4). This is a direct result of differences in storm rarity. Taking the highest ratio between storm and flood frequency, it is not possible to have a flood that takes place 35 times more frequent than the rainfall that should have caused it to happen. The ratios for the floods on the Valency and Brue for the 1917 flood are also too great to have been produced by inadequate data. In contrast to these results those produced using the rainfall frequency relations in the New Guide are much more realistic.
Discussion
For dam design and safety assessments the main finding of this paper is that the estimates of extreme rainfall are too low in the Defra (In Press) report. In making this assessment no account is made of any future changes in climate, but then no allowance was made by the present author simply because it adds more uncertainty to an already difficult area of hydrometeorology.
There are two main drawbacks to the new study. The first is the omission of the highest measured rainfall in Britain, a fact that is hard to substantiate when that is very close to the core of the investigation. The second is the big mismatch of the rarity of the flood producing rainfall and the rarity of the resulting flood. This is most clear for the rarer events and it is unfortunate that more well documented floods could not have been tested using the same procedure. A further disappointment in the Defra study is the lack of an assessment of PMP. The study has only used one method to estimate rainfall up to the 1 in 100,000 year event. The level of uncertainty at this rarity calls for the use of a wider range of techniques in order to give greater confidence in the results.
During 2010 a New Guide for flood estimation will be published. This will contain estimates of extreme rainfall, detailed examples of T-year flood estimation, and further tests of the methodology using historic floods and storm events. In that way dam safety and flood alleviation schemes can proceed on a more sound basis.
The author is Colin Clark, Charldon Hill Research Station, Shute Lane, Bruton, Somerset, England BA10 0BJ. Email: colin4chrs@hotmail.com
TablesTable 1 Table 2 Table 3