Uncertainty and the breach of Gasper dam
10 January 2008Following a severe storm in 1917, the Gasper dam in Wiltshire, UK, collapsed. Here, Colin Clark describes how the dam breached and estimates the dam break flood as it passed downstream. He also reports on a recent inspection of the structure and assesses uncertainty in the spillway design flood, the results of which could have implications for dam safety worldwide
There is an unacceptable level of uncertainty in the estimates of rare floods. Reducing that uncertainty will not be achieved by the application of one single approach. It will be solved by the use of different methods of analysis (Pappenbergar, 2006; Hutchins, 2006), together with as many cross checks as possible and an informed discussion of the results where significant uncertainty remains. The greatest uncertainty probably lies with estimates of spillway design floods for dams. Lessons from previous dam-break incidents still need to be learnt, which may help to reduce the uncertainty in estimates of spillway design flood (SDF). Evidence from near miss incidents should also be taken into account (Charles, 2005).
At present the 1975 Reservoir Safety Act has no provision for a third party assessment of the evidence where significant uncertainty exists. It does however have an option for dam owners to contest the findings of an inspection report made under the provisions of the Act. Following the Gasper incident of 1917, and the recent Inspector's report for the existing dam, this paper has three objectives. The first is to describe the collapse of Gasper dam in Wiltshire, UK following a severe storm in 1917. Second, to estimate the dam-break flood as it passed downstream. Third, to assess the SDF in the light of the recent inspection report, and to highlight the fact that unless uncertainty in the SDF is resolved, a future dam-break disaster is likely to take place. The results of this part of the investigation have serious implications for dam safety in the UK and elsewhere.
Gasper dam and its breaching, 29 June 1917
Gasper dam, which is located in West Wiltshire, UK, was built in the early part of the 19th century. It is an earth dam whose original core may not have been constructed of clay. No original drawings or other details of its design have been found. Originally its retention level was about 130m OD. The impounded New Lake received drainage from an area of 6.75km2. On the night of 28-29 June 1917 a complex area of low pressure moved up the English Channel coming close to another depression over the eastern English Channel (Clark & Pike, in press). A large belt of thundery rain fell over a wide swathe of southern England centred on Bruton some 9km west of Gasper dam. Two raingauges in the Gasper catchment area recorded 165mm. The peak discharge of the resulting flood has been estimated at about 30m3?/sec which would have overtopped the dam crest which was then, as now, a roadway.
The Salisbury Journal takes up the story: 'Shortly before two o'clock on Friday morning, by which time the lake had received an addition of many thousand tons of water by direct rainfall, and also as a result of the drainage from surrounding hills, a thunderous roar awakened inhabitants in the vicinity. Subsequent investigation revealed the entire disappearance of the lake through a channel created by the destruction of the road of about 20 yards and to a depth of about 20 feet…The raging torrent leapt forward at great speed and poured towards Gasper Mill which was about 500 yards distant and the mill house was flooded to a depth of from six to seven feet...Pen Mill was the next important object of destruction. Cottages too were flooded, in some cases the water rising to the ceilings of the lower rooms.'
Downstream at Bourton Mill: 'The unwelcome entrance of the torrent was practically undisputed. Down went the gates, and the water rushed through the works, causing considerable damage… A stack of about 200 tons of coal was promptly dispersed in all directions.' (Salisbury Journal 7/7/1917).
'Many parts of the works were flooded to a depth of from five to ten feet. In the clerical department a large safe and its contents, estimated to weigh from 15cwt to a ton, was over-turned... The caretaker lost a lot of his furniture, and made his escape from the house by means of the roof.' (Western Gazette, 6/7/1917).
Beyond the old A303 further damage was reported: 'At Silton, a district road bridge was swept away. From this point the water began to extend its course on either side, but, although its speed had slackened to some extent owing to the distance covered and the obstructions it had encountered, the velocity remained considerable. Pierston Farm...was flooded to a depth of about five feet...smaller articles of furniture..were swept out of the rooms by the force of the water, in which a piano was subsequently discovered floating... Plank House Gillingham,..which is now used as a Red Cross hospital, received the full shock of the torrent... The nurse on duty promptly telephoned for assistance...by the time she had despatched her message the water was nearly up to her arm-pits… An almost convalescent patient, (Pt. W. Robinson), valiantly assisted in the rescue of two severely wounded soldiers, and, with Dr Farnfield, brought in the men with the water reaching up to their necks. The doctor got into difficulties, and Robinson.. swam back into the torrent and after a struggle succeeded in bringing Dr Farnfield to safety.' (Salisbury Journal 7/7/1917).
The Western Gazette continues: 'The rising waters were first noticed at about 1.40 am...the water then being ankle deep... Short as was the time, when the doctor arrived the flood had become a raging torrent, breast high...by three am the flood had risen to a depth of 4ft 6ins in the house and 6ft outside...even at Blandford 20 miles away, the increased volume of water was noticed.'
The remains of Gasper dam were photographed, and also Gasper Mill 0.5km downstream (Figures 1 and 2). Both pictures confirm the scale of damage and estimated water level at the Mill.
Estimates of the dam-break flood
Figure 3 shows some of the effects of the collapse of Gasper dam and the estimated outflow discharge. As the flood surge passed into the Blackmore Vale below Bourton, considerable floodplain storage took place and at Pierston Farm the estimated peak flow was just over a third of the maximum. The three estimates of peak flow are based on valley cross sections shown in Figure 4, while Table 1 gives the survey data on which the results are based.
Uncertainty exists with these estimates. Those at Pen Mill and Pierston Farmhouse are a minimum since they are based on reported levels inside dwellings when the level outside can be higher. The n value of 0.05 is the normal value in Chow (1959) and also Barnes (1967) for these types of site. The likely peak outflow of about 400m3/sec can be compared with two empirical formulae that have been used to estimate dambreak floods. The first is that of Hughes et al., (2000).
Qp = 330(BFF)0.42 (1)
Where Qp = peak outflow (m3/sec); BFF = breach formation factor (m4 106) = VH, where V = volume of water in the reservoir at the time of failure (m3 x 106); H = peak water level (m) above base of the dam. Application of this method with H = 6.35 and V = 0.203Mm3 gave a peak outflow of 365m3/sec.
An alternative method was proposed by Froehlich (1995):
Qp = 0.607V0.295 H1.24 (2)
Where V = volume (m3), H = height of peak water level (m) above the base of the dam. This gave a result of 221m3/sec. Clearly the breach of Gasper dam exceeded these two estimates although was closer to that of Hughes et al., (2000). This may have been because the dam failed very rapidly. Reports mentioned a continuous roar of water but further details have not been found. However, a water balance check of the likely volume of water which would have left the dam shows that a peak outflow of about 400m3/sec could have flowed from Gasper Lake if it had failed in about 0.25 hour.
In 1920 Gasper dam was rebuilt on the same site. A stone plaque on the road bridge at the site commemorates this event. The dam impounds a lake with a surface area of 4.6ha, but in 1917 the surface area was 5.98ha. At the outlet a circular concrete shaft 4.8m diameter, 2.8m deep leads to a culvert with an effective area of 3.246m2. About 10m from the distal end of the culvert is a fish trap with a compound rectangular weir constructed of concrete blocks. This trap presents a 0.4m backwater to the culvert that reduces the capacity of the latter. The freeboard between the spillway and the dam crest is 1.388m. This was resolved by the apportionment of the freeboard at the lower level, comprising 0.3 of the circumference, and the higher level that makes up the remainder.
Estimates of the spillway design flood
Under current UK legislation a category A dam should be designed to safely pass the PMF which in this case is equal to the SDF because the reservoir does not attenuate the flood at all. Since 1978 the dam has been inspected five times. The most recent inspection took place in 2004 (Stourhead Western Estates, 2004). In this report the estimated PMF is given as 59m3/sec. No details were given of how this value was obtained, nor any discussion of uncertainty in the result. On this basis alone Gasper dam has to be upgraded since in its present condition it is unable to safely pass this discharge. However, seven other estimates of the PMF have recently been made by the author and a copy of the report sent to both the Environment Agency as the enforcing authority, and also the inspecting engineer. Table 2 below shows the results.
Discussion of the results in Table 2 centers on uncertainties in the input data, the validity of the transposition and maximisation process, and the relative accuracy of the FEH rainfall runoff method (IOH, 1999) versus the non-linear flow model (Clark, 2004a).
The results of using the UH method are sensitive to the time to peak. In using the FEH UH the T year time to peak of 1.91 was reduced by 0.67 to give 1.28 hours. In the case of the non-linear flow model the time to peak equation for the nearby Upper Brue was adjusted according to the ratio of mainstream channel length (3/9.2) to give a time to peak of 0.86 hours which was increased to one hour to make an allowance for reservoir lag time.
There is uncertainty in the % runoff values. Measurements of saturated hydraulic conductivity (Ksat) in the catchment area have shown that the FEH values are too low. This was also the conclusion of a recent study of the adjacent river Brue (Black and Veatch, 2006). When the Ksat based % runoff values are applied to the FEH method with storm transposition and transposition and maximisation of the Martinstown storm, the resulting peak discharges increase to 75 and 123m3/sec respectively.
The WMO manual for estimating PMP (WMO, 1986) suggests that storms can be transposed or physically moved to another area from which they took place providing certain conditions are met. These include similar meteorological and physiographic conditions. For present purposes the Martinstown storm took place 45km to the south of Gasper dam. The annual average rainfall (1941-70) is about the same in both areas. Although detailed storm intensities are not available, the storm began at about 2.30 hrs GMT (Bleasdale, 1956) and during the storm Norris Symonds took a spot reading of 190mm at 1900 hrs GMT. The suggested storm profile in Clark (2005a) gives a peak hourly rainfall intensity of 55mm hr-1 which is well below the estimated hourly PMP value for this area of about 150mm hr-1.
The process of storm maximisation has a long history and whilst there is the possibility of excessive maximisation the moisture maximisation factor for the Martinstown storm is 1.46 which is well below the value quoted elsewhere of 1.75. Although Papalexiou and Koutsoyiannis (2006) have criticised the maximisation process as being arbitrary, the use of 100 year maximum persisting dewpoints does give estimates of short duration PMP that have been matched by at least two historic storms; one took place over the Cheviot Hills in 1893 (Clark, 2005b), and the other near Boltby Reservoir in June 2005 (McCulloch & Clark, in prep.) Whatever method is used the results should be supported by observations or other analyses.
Two UH methods were used to estimate the SDF. In the FEH UH the percentage runoff is based on the HOST classification of soils, giving a fixed value for percentage runoff for the whole storm. The UH ordinates vary in a linear way, while there is a constant time to peak throughout the storm. In the non-linear UH method the percentage runoff is based on field measurements of Ksat in the catchment area. The resulting frequency distribution of Ksat values are combined with rainfall intensity at a chosen time interval – usually 0.5 hours – to give a variable rate of runoff. The UH ordinates are based on a logistic function taken from biology, while the time to peak varies according to the rainfall intensity for each part of the storm.
The accuracy of these two methods of flood estimation was tested by using the storm of July 1982 which took place in the local area. Observations made during the storm showed that New Lake filled up with slight overtopping of the dam crest. Under these conditions the expected inflow discharge should be 24m3/sec with an outflow of 17m3/sec. The FEH predicted a peak inflow of 12m3/sec at Gasper dam. The non-linear flow model gave a peak inflow and outflow of 23 and 16m3/sec respectively.
This would lead to the lake level rising to within 0.028m below crest level. Any wave action at this time would give rise to a slight overtopping of the crest. The outflow of 17m3/sec is supported by an estimate of the peak discharge of 25m3/sec at Bourton Mill located 2km downstream and where the catchment area is 11.2km2. An outflow of 12m3/sec could not result in such a high discharge at Bourton Mill.
Given the uncertainties of estimating extreme floods, from the UH results shown in Table 2, a SDF in the range 100-150m3/sec is suggested. This gives a runoff rate of 15-22m3/sec per km2. This can be compared with the rate of runoff in moderately serious floods in 1960 such as at Alphin Brook (Brierley, 1965) and Withycombe Brook (Harrison, 1961), of 8.8 and 7.6m3/sec per km2, where the catchment areas are 7.2 and 7.5km2 respectively. Although these are much lower than the maximum range expected for Gasper dam, the depth of rainfall for these floods was only about 50mm, showing that the Inspector's value of 8.7m3/sec per km2 for Gasper dam is far too low to be credible.
The range 100-150m3/sec for the SDF is too wide and needs further refinement. The estimate using revised values of PMP (Clark, 1995, 2002) is consistent with that produced from flood frequency analysis.
In this analysis the crucial issue concerns the estimated rarity of the 1982 and 1917 flood without dam-break, whose peak discharge have been realistically assessed at 24 and 30m3/sec respectively. Table 3 shows the results of applying the joint probability model (Clark, 2007) to these two flood events:
Rp(flood) = Rp ER * Rp (SMD) (3)
Where Rp = return period (years), ER = effective rainfall (rainfall - SMD), SMD = soil moisture deficit.
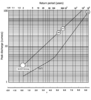
In order to place these results into context the bankfull discharge of the river at a stable reach 80m below Gasper dam was estimated from direct current meter gaugings. Between this site and the dam there are no tributaries that enter the main river. The result was 3m3/sec. This result was lower than a wider reach just downstream of the measured site but felt to be representative of the channel reach as a whole. Combining the results from table 3 and the estimated bankfull discharge which has a return period of about two years, gives the flood frequency curve (Figure 5). Also shown are the results from the FEH and the revitalised rainfall-runoff method, ReFH (Kjeldsen et al 2005).
If the latter result is accepted then the likely return periods for the 1917 and 1982 floods would be about 1000 and 5000 years respectively. Since the rarity of the effective rainfall for the 1982 event was only just over 100 years this can hardly be correct. Once again the historic record has shown how FEH procedures are underestimating extreme floods.
From the results of flood frequency analysis, and the estimates from rainfall runoff methods the likely SDF is in the range 130-150m3/sec or about 2.5 times the estimate given in the inspector's report (Stourhead Western Estates, 2004).
Previous overtopping events
In the inspector's report (Stourhead Western Estate, 2004) of Gasper dam, carried out under Section 10 of the Reservoirs Act (1975), the Water Bailiff Malcolm Bullen stated that the dam had been briefly overtopped two times during the past 30 years while he has lived at the Laundry House which is next to New Lake. If this statement is correct then it is great cause for concern, not only because of its occurrence but also because of the light that it may throw upon some of the estimates of PMF. Bullen was interviewed during February 2007 and asked to confirm the two incidents of overtopping. They were confirmed, but no year or date could be recalled. However, he was clear that during these two events the culvert was not blocked by any debris.
Furthermore, when questioned as to the time of day and season he was clear that they both took place during the day and in the summer, when, according to him, a heavy storm took place. There is no doubt that one of those incidents was during the storm of July 1982 when the area received about 100mm, much of which fell in four hours.
In the same report it is suggested that the existing dam could retain floods up to about the 1 in 10000 year event. Since there have been two minor overtopping incidents during the past 30 years this suggestion is unlikely to be true. Even allowing for a significant error in the estimation of the return period of the 1982 flood does not make its rarity as high as 1 in 10000, as compared with a more likely value of about 1 in 260.
Discussion
The wide range of estimates of the SDF at Gasper dam has highlighted weaknesses in some of the methods used in this paper. Designing up to a 1 in 10000 year standard will not placate public uproar in the event of an incident which exceeds this standard, causes a breach in the dam and subsequent loss of life.
The situation as regards PMP and dam safety is even more serious in India. In 1999 Rakhecha and Clark produced a revised estimate of PMP for the whole of India. It received both formal (Dhar and Nandargi, 2000) and informal criticism that the estimates were far too high. Previously the Atlas produced by the Indian Institute of Tropical Meteorology (IITM, 1989) gave 1-day PMP at Mumbai as 70cm. Rakhecha and Clark (1999) suggested 120cm on the basis of storm maximisation and transposition and the junior author wondered if he would live to see the lower estimate exceeded. In July 2005 Mumbai recorded 94cm in one day. Similarly, in 1996 when the present author reported to the Environment Agency that the SDF for Bruton dam should be more than doubled he was met with disbelief. Now, 11 years on, design work is in progress to upgrade the dam. Yet even as late as 2003 one consultant's report confirmed the original design inflow. This estimate did not take account of the historic floods, flood events nationwide, or new estimates of PMP. This illustrates that consultants must be prepared to take account of all available evidence in a discussion of uncertainty.
The high cost of dam refurbishment has to be justified in terms of realistic estimates of the SDF, where the level of uncertainty is acceptable to all interested parties. Reduction of uncertainty is not a requirement of the 1975 Reservoirs Act. If it were the case then more cooperation from the inspecting engineer would have been forthcoming. Although hydrologists are willing to discuss uncertainty, it is not always considered by dam engineers. This approach cannot be sustained in the light of recent evidence, the need to treat catchments on a case by case basis, and the uncertainty of future trends in climate. However, there have been no recorded 1-day falls in excess of 203mm (8 inches) since 1955 in the UK, whereas in the previous 45 years there were at least four such events. Similarly the frequency of destructive hailstorms has declined since 1650 (Clark, 2004b).
Nevertheless, the full range of natural variation of the weather system has yet to be measured. The oil drum and bucket catch at Blackdown in 1955 and the Cheviot Hills in 1893 both show that FEH PMP for 24 hours and two hour duration have been exceeded.
Where public safety is concerned it may be wise to adopt a higher design standard and to be prepared to discuss uncertainty where reasonable doubt exists. In the case of Gasper dam a SDF of 59m3/sec is considered too low by the author, who suggests that future improvements to the dam should adopt the higher value as described above.
Colin Clark, Charldon Hill Research Station, Shute Lane, Bruton, Somerset, England BA10 0BJ.
Email: colin4chrs@hotmail.com
To read more on flood management issues throughout the world, why not try a keyword search in our extensive archive at www.waterpowermagazine.com. Here you’ll find all the articles we’ve published since January 1998
| References |
| Barnes, H.H. (1967) Roughness characteristics of natural channels. USGS Water Supply Paper, 1849. Washington. |