Worth the risk
18 August 2005A Portfolio Risk Assessment (PRA) is being carried out by Hydro Tasmania to examine the risks and consequences of induced hydraulic transients for 26 of its Francis, Kaplan and Pelton power stations. Craig Ludlow presents a summary of the PRA methodology along with the data collection and transient modelling processes carried out for each station
Hydro Tasmania is the state owned provider of hydroelectric power in the island state of Tasmania, Australia. Hydro Tasmania Energy, as owner of 27 power stations in Tasmania, is undertaking a Portfolio Risk Assessment (PRA) to determine the condition of its assets in order to better manage the risks and consequences of induced hydraulic transients. Many of the assets owned by Hydro Tasmania Energy are aging (turbines commissioned as early as 1938) and the level of risk associated with the assets is not completely understood.
Figure 1 shows Lake Echo Power Station penstock which burst on 27 February 1960 when a turbine relief valve (TRV) failed to operate during a full flow load rejection. To minimise the risk of such a failure occurring again, the PRA was initiated to provide a better understanding of Hydro Tasmania’s assets with regard to:
• Confirming and quantifying the scale of these hydraulic transient risks with a focus on penstock pressures and turbine overspeed under load rejection.
• Identifying currently unknown risks and critical hydraulic transient scenarios for each of the power stations in the study.
• Reviewing the typically conservative design pressure profiles using modern hydraulic transient analysis software packages.
• Reviewing penstock, pipeline and surge tank structural adequacy using modern design codes and procedures based on current condition.
• Reviewing general station operation in relation to induced hydraulic transients.
The 26 power stations included in the PRA were initially separated into 5 priority groups to provide a systematic approach to the study with the most risk exposed stations placed in Priority Group 1. A summary of the five different Priority Groups is provided below:
Priority Group 1
Francis and Pelton turbine power stations (5) with penstocks that display notch brittle behaviour at operating conditions and/or have TRVs, commissioned between approximately 1938 and 1957.
Priority Group 2
Francis turbine power stations (4) that have TRVs, commissioned between approximately 1969 and 1971. Due to additional maintenance costs associated with TRVs and the potential for them to fail to operate during a turbine load rejection, Hydro Tasmania Energy is considering the removal of TRVs from these stations.
Priority Group 3
Kaplan turbine power stations (4), commissioned between approximately 1967 and 1972. The potential for column separation to occur in the draft tube of these stations is a current concern for Hydro Tasmania.
Priority Group 4
Pelton turbine power stations (2), commissioned between approximately 1965 and 1977. The stations do not experience large penstock pressures during load rejection transient events due to long spear closing times, however both stations have long lengths of exposed steel penstock. Resonance due to turbine spear oscillation was considered to be a critical transient condition during the design of these stations.
Priority Group 5
Francis turbine power stations (10) with short concrete encased headrace conduits and no hilltop valves HTVs, commissioned between approximately 1962 and 1991.
Hydro Tasmania Consulting, the consulting business unit of Hydro Tasmania, is carrying out the hydraulic transient modelling and penstock structural assessment for the PRA. This paper focuses on three of the Priority Group 1 stations (Lake Echo, Wayatinah and Tarraleah) and in particular the hydraulic transient modelling component of the study.
PRA methodology
At the onset of the study a methodology was developed by Hydro Tasmania Consulting for the PRA to ensure a consistent, efficient and rigorous approach was applied to all of the stations being investigated. The methodology detailed:
• The overall approach for the study including station priority.
• Inputs required from Hydro Tasmania Energy for the steel penstock condition and structural assessment components of the study.
• Inputs required for the hydraulic transient modelling (turbine characteristics, valve characteristics, infrastructure design drawings and measured test data).
• Required station testing to provide calibration data for the hydraulic transient modelling.
• Proposed software and methodology for the hydraulic transient modelling.
• Proposed methodology for the penstock structural assessment.
Software evaluation and description
Research was carried out initially to identify commercially available software packages that provided the necessary features to accurately model all or most of the components of the power stations in Hydro Tasmania’s portfolio. Required features that were considered to be particularly important for the success of the study included:
• User friendly interface.
• Automatic steady state hydraulic grade line calculations.
• Capacity to model Francis turbine operation.
• Capacity to model non-linear guidevane and valve closures.
• Capacity to model variable area surge tanks.
• Ability to model water column separation.
• Real time graphical on-screen output during model runs.
• Customer support.
An extensive search was carried out and the Hytran software package was adopted as it provided the majority of the required modelling features. Throughout the study, enhancements were made to Hytran, particularly Francis turbines and valve closure scenarios, by the software developer based on advice and requests from Hydro Tasmania Consulting. These enhancements significantly increased the ability of Hytran to model hydroelectric installations.
Hytran is based on the Method of Characteristics with an algorithm that sets up a fixed computational grid, i.e., the time interval and grid length are constant during the computational process. The program uses a simplified single-phase flow approach to model column separation in tracking the size of the cavity as it grows and closes upon flow reversal. Francis turbines are modelled using the method proposed by Streeter and Wylie (1983). Hytran has the capacity to model specific Hillcharts (turbine characteristic curves) input by the user. Typically the Hillchart is represented by two sets of curves, Unit Flow versus Unit Speed and Unit Torque versus Unit Speed. However, the Hillchart can also be represented in Hytran by other parameters including by Efficiency verses Unit Speed and Unit Power versus Unit Speed.
Description of priority group 1 power stations
The general features of three of the five Group 1 Power Stations are summarised in Table 1 with the turbine characteristics summarised in Table 2. Figure 2 shows the Wayatinah woodstave pipelines and surge tower while Figure 3 shows the Tarraleah penstocks.
Data collection
Data collection was considered to be an important component of the study given the sensitivity of the modelling results to many of the input parameters (in particular valve operating and dead band times). A significant amount of effort was put into this task and the following data was typically collected for each station:
• Design and “as constructed” drawings for the station infrastructure (intake, tunnels, surge shafts, penstocks etc).
• Original commissioning data for valve and turbine operation.
• Current station settings (eg valve and turbine closing and opening times) and their dependence on operating conditions (ie temperature).
• Headloss test data for calibration of the hydraulic model.
• Transient test data for valve closure and turbine load rejection for model calibration.
• Valve discharge characteristics.
• Francis turbine characteristics.
The most difficult data to obtain was valve discharge characteristics and Francis turbine characteristics, which was due to the information (Hillcharts or model test data) not being available. With many of these early stations, the manufacturers did not provide the valve and turbine characteristics to Hydro Tasmania.
Missing valve characteristics were based on similar valves in other power stations operated by Hydro Tasmania. For the stations where no Francis turbine information was available, the Hillcharts from ‘similar’ turbines within Hydro Tasmania’s portfolio were adopted. The similarity was based on: turbine specific speed; review of general turbine characteristics (eg number of runner blades); and Turbine type.
Development of transient scenarios
The main focus of the hydraulic transient analysis was the modelling of what were perceived to be the worst-case transient conditions in relation to maximum penstock pressures, Francis turbine speed rise and the assessment of the removal of turbine relief valves from the Francis turbine power stations. To facilitate the identification of the critical transient scenarios relevant to the study, workshops were held with asset engineering representatives from Hydro Tasmania Energy who, based on operational experience, had a good understanding of the transient issues for each of the Group 1 stations.
The scenarios adopted for the study were split into the following two categories for the structural assessment component of the study as the factors of safety varies between the two operating conditions:
• Normal operating conditions: Hydraulic transient conditions that can occur during normal operation of a power station.
• Emergency operating conditions: Hydraulic transient conditions that can occur as a result of a failure of a piece of equipment to operate in the design manner (eg failure of turbine relief valve to open during turbine load rejection or open/close at times significantly different to design times).
Hydraulic transient modelling
As discussed above, the Hytran software package was used to model the Priority Group 1 stations. The hydraulic modelling for the study generally followed the procedure set out below:
• The headrace conduit network was set up as a series of pipes and nodes.
• Boundary conditions (upstream pond levels, surge tanks, valves, turbines and tailwater levels) were set-up in the hydraulic model.
• The hydraulic models were then calibrated to headloss test data and hydraulic transient test data for each component in the model used to simulate a transient condition.
• Hydraulic transient modelling for the adopted transient scenarios.
Calibration of the hydraulic transient models to recorded test data was critical and the most challenging part of the modelling process and, without calibration, results from the transient modelling would have been unreliable due to:
• Lack of discharge characteristics for HTVs, main inlet valves MIVs, and TRVs.
• Lack of Francis turbine characteristics for some stations.
• Assumed Francis turbine characteristics in the region of approximately 0% to 20% guidevane opening.
As discussed above, Hillchart data was not available for two of the four Francis turbine stations modelled in Priority Group 1 and therefore Hillcharts from ‘similar’ turbines in Hydro Tasmania’s portfolio were used in their place.
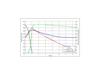
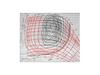
It was found that all the Hillcharts used for the Group 1 Stations were limited in the range of turbine operation that they covered. Figure 4 shows the typical Hillchart data that was available where: the Hillchart covers only the area of general operation of the turbine; and there is no information for guidevane openings less than approximately 10-20% which is critical data required for correct simulation of the final stages of guidevane closure.
It was therefore necessary to extrapolate the available Hillchart data to cover the full range of turbine operation from normal operation to fully closed. The extrapolation was a trial and error process based on other full Hillchart data (ie engineering judgement) and calibration using the Hytran model. A typical extrapolation of the Hillchart data is shown in Figure 4.
The calibration process was critical in developing reasonable extrapolations for the Hillcharts and involved a comparison between load rejection test data with predictions from the Hytran transient model. Modifications were made to the Hillchart (and other modelling data where required) until a good match was achieved between the test data and model predictions. Where additional load rejection test data was available, a second calibration or verification of the transient model was carried out to confirm the calibration.
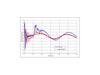
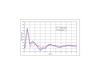
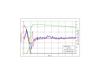
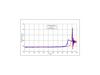
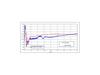
Where test data was available, the hydraulic transient models were calibrated for each item of equipment being used to induce a transient event. Figures 5 to 10 are examples of calibration plots showing predicted and measured penstock pressure (just upstream of the piece of equipment in operation) versus time for Tarraleah, Lake Echo and Wayatinah power stations.
Using the calibrated hydraulic transient models, the adopted transient scenarios were analysed for each station. Typical results obtained from the modelling included:
• Penstock pressure and valve position versus time plots for MIV and HTVs.
• Penstock pressure, guidevane position, TRV position and turbine speed versus time plots for Francis turbines.
• Penstock pressure and spear position versus time plots for Pelton turbines.
• Surge tank water level versus time plots.
• Maximum pressure envelopes for Normal and Emergency Operating Conditions for use in the penstock structural assessment.
• Required guidevane closing times when TRVs removed from operation, including an assessment of associated speed rise.
• Required guidevane or valve closing times to keep peak penstock pressures within allowable limits.
• Required guidevane or valve closing times to prevent cavitation within the penstocks.
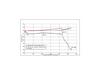
Figure 11 shows a typical set of Normal and Emergency Maximum Pressure Profiles that were developed for the Tarraleah Power Station English Electric machines. It can be seen that upstream of the HTVs, the Emergency pressure profile is dictated by faster than normal HTV closure.
Benefits of the PRA
The PRA was successfully completed for the Priority Group 1 stations and the benefits of the comprehensive hydraulic transient modelling being carried out in combination with the penstock structural assessments were immediately apparent. The PRA lead to a number of significant conclusions and recommendations being made about the operation of the Priority Group 1 stations. In particular:
Tarraleah
As described in Table 1, Tarraleah power station consists of three English Electric and three Boving Pelton turbines. The Normal Pressure Profile for the English Electric machines was found to be significantly higher than the Boving machines due to the influence of the English Electric machine diffusers. However, the detailed structural assessment identified that due to the steel type used for the Boving penstocks (the first penstocks to be constructed), the stresses within these penstocks were typically at or slightly above the allowable limit for normal operating conditions while the stresses within the English Electric penstocks were well below allowable limits. It was recommended that lengthened spear closing times be assessed to reduce the peak pressures within the Boving penstocks resulting from turbine load rejections.
For Tarraleah the study highlighted the impact (relating to hydraulic transients) of having penstocks constructed from three different types of steel.
Wayatinah
Based on the transient scenarios carried out and the penstock structural assessment the station was found to be operating within allowable limits (penstock stresses) for both normal and emergency operating conditions.
The investigation of turbine relief valve removal indicated that it was not feasible to remove the relief valves from operation due to the unrealistic guidevane closing times (and associated high turbine speed rise) that would be required to keep penstock pressures below allowable limits.
Lake Echo
The transient modelling carried out for Lake Echo power station highlighted the sensitivity of pressures within the penstock (both positive and negative pressures) to guidevane and TRV operating times (including dead band time, opening time and closing time). The modelling also indicated that upon failure of the relief valve to operate during a load rejection of the turbine (emergency operating condition), the allowable pressures within the penstock could be exceeded.
Given the high sensitivity and the dependence of the guidevane and TRV operating times on temperature and the exceedance of allowable pressures in the event of the relief valve failing to operate, changes to guidevane closing times were recommended for this power station.
Conclusion
A methodology was developed by Hydro Tasmania Consulting for a Portfolio Risk Assessment, to examine the risks and consequences of induced hydraulic transients for 26 of Hydro Tasmania’s Francis, Kaplan and Pelton power stations. The PRA was successfully carried out for the most critical power stations in Hydro Tasmania’s portfolio (Priority Group 1 stations) that included four Francis turbine power stations and one Pelton turbine power station.
The PRA enabled a consistent and rigorous approach to the study, which included hydraulic transient modelling and detailed pipeline and penstock structural assessments for each of the power stations.
The hydraulic transient modelling was carried out using the Hytran software package and included the assessment of Normal and Emergency Operating conditions for each of the power stations along with a number of investigative scenarios including the assessment of relief valve removal from Francis turbine power stations.
Significant conclusions and recommendations were drawn regarding the operation of each of the five power stations in Priority Group 1.
Graphical presentation of the transient modelling results, including maximum pressure profiles and penstock pressure and turbine speed traces, allowed for easy interpretation of the study results by the client.
Upon completion of the Priority Group 1 stations, the priority of the remaining stations was revised due to current upgrade and modernisation projects being carried out by Hydro Tasmania Energy. The PRA is now being continued by Hydro Tasmania Consulting with the hydraulic transient modelling of Priority Group 4 stations currently underway.
Author Info:
Craig Ludlow is senior engineer at Hydro Tasmania Consulting.
The modelling for this article was carried out by Emma Birch and Joshua Chugg
TablesTable 1 Table 2