Model for success
15 March 2006CFD modelling can help improve flow measurement in low-head intakes, says Dr Latif Bouhadji
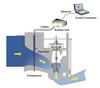
ASL AQFlow Inc has developed the Acoustic Scintillation Flow Meter (ASFM), a portable, non-intrusive instrument for measuring flows in low-head intakes1, as shown in Figure 1. Factors such as rapidly converging geometries, upstream obstructions (trashracks or fish diversion screens) and inflow conditions leading to flow separation cause large variations in the distribution of velocity and turbulence in the measurement zone and thus affect the ASFM performance.2 To provide a better understanding of the effects produced by these factors on the mean flow velocity and turbulence characteristics sensed by the ASFM, and to help identify its optimum setup, computational fluid dynamics (CFD) studies were carried out with Ansys CFX (CFX-4.3 and CFX-5.6) software. Ansys ICEM CFD was used to mesh the large regions involved.
CFD numerical implementation
The first two and three dimensional studies were carried out for the Lower Monumental power plant in the US, where the ASFM measurements were particularly successful,3 in order to gain confidence in the numerical model.
The two dimensional numerical simulation was performed with an older version of the commercial code CFX (CFX 4.3). This code uses a multi-block finite-volume method to solve the discretised Navier-Stokes equations in conjunction with various turbulence models. The code also provides a pre-processor for grid-generation and a post-processor for data analysis. In the finite volume method, the governing differential equations were integrated over control volumes defined by the grid.
The three dimensional study of the same intake, and the CFD modelling studies carried out after that, were performed with Ansys CFX 5.6. The complex 3-D geometries, including trashracks, fish screens and circular pipes supporting the ASFM frame, required large computational power. Thus, parallel computations were undertaken with a cluster of three PC’s using a Linux platform.
Turbulence modelling
Resolution of the instantaneous fluctuating flow field in turbulent flows is not feasible for complex flows. Engineering methods implemented in CFD rely on the numerical solution of the Reynolds-averaged Navier-Stokes (RANS) equations in conjunction with turbulence models of varying degrees of complexity, ranging from algebraic eddy viscosity to Reynolds stress models.
In the eddy viscosity models, such as the basic K-e or the RNG K-e models, the Reynolds stresses are linearly related to the mean velocity gradients in a fashion similar to the relationship between the stress and strain tensors in laminar Newtonian flows. In Reynolds stress turbulence models (RSM), the eddy viscosity hypothesis is not invoked. Instead, a transport equation is defined for each component of the Reynolds stress tensor. This model provides a conceptually more correct representation of turbulence characteristics such as anisotropy and the effect of extra strains, but is more complex and computationally intensive.
As a result of the substantially lower computational effort required, the K-e model is still one of the most commonly used turbulence models for the solution of practical engineering flows. There is, however, a large amount of evidence indicating that though the K-e model reproduces qualitatively many of the important flow features, it is not totally satisfactory in some complex flow situations, particularly those involving flow separation.
In this study, in addition to the K-e, a variant of the RNG K-e model was also tested. This variant includes a strain dependent correction that has been shown to improve the predictive capabilities of the model. No significant difference in the results has been found between the two models (in regions of interest).
Lower monumental intake
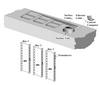
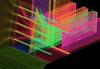
The 3D computational domain of the Lower Monumental intake is shown in Figure 2. The dimensions of the trash rack modules are 8m wide by 3.94m high. Each module includes three vertical beams, six 20cm wide horizontal I-beams and 55 thin vertical bars. Six modules are installed in each trashrack slot of each of the three intake bays. The ASFM measurement plane is about 22.25m downstream from the trash rack. The diameters of the top and bottom cylinders supporting the ASFM frame are, respectively, 21.9cm and 27.3cm.
The CFD simulations were carried out for three flow rates: 113.283, 165.58 and 206.72m3/sec, slightly different from the flows at which the ASFM data were collected.
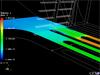
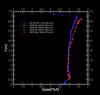
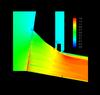
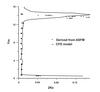
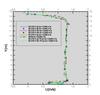
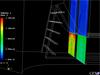
Although only two dimensional, the numerical results show a good agreement with the ASFM measurements for all tested flow rates4,5 (see figure 5). The trash rack was found to increase the velocity flow field in the bottom region of the intake and to slow it down at the top region (Figure 3). The velocity deficit caused by the thick horizontal beams propagates downstream all the way to the ASM plane of measurement. These effects are emphasised with increasing flows. The distribution of the mean horizontal velocity near the top and bottom is shown in Figure 4.
The three-dimensional computation has shown that the 3D effects on the side wall boundary layer are confined to a region of the gate slot, close to the bottom (up to 1.5m above the floor). In the remaining domain, along almost the entire measurement plane, the side wall boundary layer thickness does not change significantly.
Hydro Kennebec intake
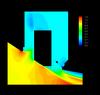
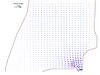
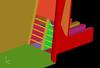
An oblique flow at an intake entrance can often lead to a separated flow, irregular distributions of velocity and turbulence in the intake and significant biases in the velocity measured by the ASFM. The configuration of the Hydro-Kennebec power plant intake presents such inflow conditions: large curvature at the entrance to one of the two units and a resulting oblique flow at the inlet (Figure 6).
The Hydro-Kennebec power plant consists of two units: Unit 1 with a large inlet curvature (7.3m radius) leading into the intake, and Unit 2 with a straight wall upstream of the entrance. The units are separated by a 1.8m thick wall, and both intakes are 15.4m high and 7m wide.
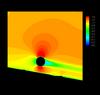
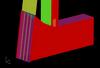
The trash rack (Figure 7) consists of five 25cm wide horizontal I-beams and forty thin vertical bars. Only the horizontal I-beams are included in the computational domain. The 3m diameter semi-circular front end of the turbines is also included. The cylindrical cross pipes of the ASFM frames are located at a distance of about 9.34m downstream from the trash rack, with the ASFM plane of measurement located just upstream of the cylindrical pipes, at about 9m distance. The distance between the ASFM measurement plane and the turbine front end is about 1.5m. Figure 8 shows a partial view of the unstructured mesh generated with more than 3.6M nodes with ICEM-CFD grid generator. The parallel computations were run in a cluster of three computers totalling 4.5GB of memory. The mean velocity directions at the inlet boundaries were obtained from a large scale numerical model (AQFlow’s in-house code, ASL-COCIRM 3D6).
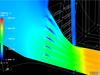
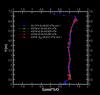
The CFD simulations confirmed the presence of large wakes produced by the trash rack horizontal supports (Figure 9). Also as expected, a large flow recirculation starts at the intake entrance of Unit 2. The velocity profile predicted with Ansys CFX shows a very good agreement with both the ASFM data and Nortek Doppler Velocimeter data collected in Unit 1, where no separation was present. However, no such agreement was indicated between the ASFM and the CFD data for the Unit 2, where flow separation did exist (figure 10). This observation has led to a thorough re-analysis of the ASFM technique. Modifications based on this re-analysis significantly improved the ASFM accuracy when dealing with oblique inflow conditions such as those encountered in Unit 2.
Conclusions
The CFD studies with the parallel software Ansys CFX successfully modelled the turbulent flow in low head plant intakes, as confirmed by the agreement with the field measurements. In addition, the CFD model results were then successfully used to optimise the placement of the ASFM transducers and to predict the ASFM measurement biases under oblique inflow conditions.
Author Info:
Dr Latif Bouhadji is a CFD Modeller with ASL AqFlow Inc, Sidney, British Columbia, Canada. Email: lbouhadji@aslenv.com