Slope spotlights
21 March 2011Historical seismic impact on two US embankment dams and dyke construction on soft ground for a major Canadian hydro scheme are examined by Geo-Slope’s modelling software. Report by Patrick Reynolds
Geo-Slope International has used a range of its modelling software to compare with findings of embankment behaviour resulting from the 1970s earthquake that damaged the Lower and Upper San Fernando dams, in California. It has also undertaken a probabilistic analysis of the extensive dyke structures constructed on soft ground for the James Bay scheme, in Quebec.
On the morning of 9 February 1971, a 6.6 magnitude earthquake struck southern California and affected the embankment structures at the San Fernando reservoir on the northern edge of the Los Angeles area. The Lower San Fernando Dam suffered a liquefaction failure, while the Upper San Fernando Dam was also affected but not as seriously. As a result, the reservoir was drained while communities downstream were evacuated.
The San Fernando dams are, consequently, important case histories in geotechnical earthquake engineering. Therefore, Geo-Slope says it is important for its GeoStudio package, in particular QUAKE/W, to be able to address such as benchmark incident. Also used is SEEP/W, SLOPE/W and SIGMA/W for aspects of the analyses.
The SLOPE/W software was also used for a probabilistic analyses relative to a published case history concerning the James Bay scheme which called for construction of approximately 50km of dykes on soft and sensitive clay. The design complexities and challenges of the geotechnical works, such as appropriate factors of safety and selection of strength properties, has also led this project to be an often cited, and referenced, case history, if not possible benchmark status in some quarters.
Lower San Fernando Dam
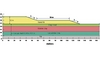
Lower San Fernando dam is 44m high, clay core embankment structure with 1:2.5 vertical-to-horizontal slopes, and the berm on the downstream has a slope of 1:4. The elevations of the crest and reservoir are El 349m and El 338m, respectively.
The seismic shock in 1971 led to failure of the upstream side, resulting in a head scarp where the slope slumped to expose the upper failure zone, and there was little remaining freeboard. Consequently, there was little margin left to protect against flow erosion, though fortunately that didn’t happen and the reservoir was drained over four days.
Dam construction was undertaken on 5m thick stream-bed alluvium. With the lower two-thirds of the dam constructed primarily by hydraulic fill placement – dry fill dykes surrounding settling slurries – the fill grading ranged from coarse silty at the outer edges to more clayey soil towards the centre. There was rolled fill on top, though that is viewed to have had somewhat minimal compaction.
For the analysis, Geo-Slope says, the entire hydraulic fill is treated as one material as the results give a picture closer to what happened after the earthquake. From more recent studies and investigations on possible stratification between thin slay and sand layers, there is also the view there were excess pore-pressures generated in the core area like the remainder of the fill.
Geo-Slope also notes that soil properties are estimates, in large part, but adds that stability is the main issue and the estimated values are adequate to understand the observed behaviour and processes.
Generally, the alluvium, outer shell, top rolled fill and downstream berm are treated as somewhat more competent than the hydraulic fill.
However, little information is available in the literature on the slope of the collapse surface, notes Geo-Slope. For the analysis, a value of 20 degrees was chosen, arbitrarily, and which is approximately 0.6 of the effective friction angle.
Modelling
Geo-Slope used the SEEP/W software to establish long-term, steady-state seepage conditions and pore pressures. With the piezometric surface (watertable) high up the dam, approximate conductivity functions, including saturated, were adequate for the analysis. Then, taking those data, and weights of soil and water, there would then be the possibility of establishing initial total and effective stress distributions with analysis either by QUAKE/W (static-type investigation) or SIGMA/W (insitu).
Based on the data analyses, the factor of safety is more than 2.0, and so fairly high – consistent with findings from investigations discussed in the literature.
Using QUAKE/W again, a dynamic analysis would then simulate the seismic shock to help to determine excess pore pressures, zones where there is risk of liquefaction or soil strength weakening to steady-state strength. The seismic event was estimated, from nearby recording station records, to have a peak acceleration of 0.6g and total duration 14 seconds, including all significant peaks only.
For the dynamic analysis, the Equivalent-Linear Method (ELM) was used with shear modulus modified by strains that develop during the shaking. Damping ratios were defined and specified by various functions, such as cyclic shear strain. The ELM approach in QUAKE/W is formulated to compute excess pore pressures based on Cyclic Stress Ratios – specifically, the Cyclic Number Function and Pore Pressure Ratio.
Also, from the calculated dynamic response of the structure to the seismic event, there is no significant amplification or unrealistic damping, which is consistent with the findings reported in the literature.
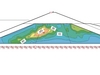
In terms of the analysis for liquefaction, a point of significance is the high deviator stress ratios in the central part of the hydraulic fill and this is an area where seismic shaking could result in reduced strength to steady-state levels.
QUAKE/W flagged as a liquefaction zone where the stress ratios are initially above or on the collapse surface. The analysis showed a ‘tongue-shaped’ zone that was more horizontal towards the lower upstream face, and in the lower position of the hydraulic fill, and it is viewed that this zone was at the root cause of the liquefaction and subsequent instability of the dam. There is also a view, based on more recent research, that the possible clay-soil stratification, mentioned above, may have led to strength loss in the core area – and which is suggested by the analytical results from QUAKE/W.
There is strong evidence, as reported in the literature, says Geo-Slope, that the major slip did not begin until the earthquake stopped. This means, it says, inertial forces were not the cause of the collapse but rather it was due to excess pore pressure build-up and the consequent loss of strength in the dam.
As such, gaining an understanding of the key issues and mechanisms delivers the benefit sought from the modelling approach, even with simple estimates of the material properties in the dam structure, says Geo-Slope. This approach is true for any project, it adds, and based on the results obtained engineers can be more informed as to where they might choose to elect and direct additional efforts and resources on further site investigation and testing.
James Bay
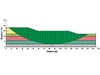
At James Bay, the long dyke is 12m high with 1:3 slopes and a 56m wide berm at mid-height. It was constructed by sand fill. The foundation strata are clay crust (approx 4m thick) over marine clay (8m) and lacustrine clay (variable thickness) over glacial till.
The main controlling issue is the strength of the lower clay layers, which were examined by vane tests at 1m depth intervals at a number of locations during site investigation work. Data showed scattered strength measurements., with mean undrained strength of the lower clays in the 31kPa-35kPa range.
For the SLOPE/W analysis of the long dyke-on-soft ground problem faced by engineers on James Bay, Geo-Slope notes that views diverged over the selection of appropriate factors of safety and strength properties. For the project itself, an international committee was established to address the engineering challenge, and a probabilistic stability analysis approach was adopted to look at the uncertainties and spatial variability in soil properties.
Eight parameters with variability, and assumed normal bell-shaped curve distributions, were considered in the stability analysis:
• Dyke Embankment Sand: Unit Weight; Friction Angle.
• Clay Crust: Thickness.
• Marine Clay: Strength; Vane Correction.
• Lacustrine Clay: Strength; Vane Correction.
• Depth to Glacial Till.
The current version of SLOPE/W cannot work with some of the variable parameters – Crust thickness, depth to Glacial Till and vane correction factors. However, they are considered indirectly, later in the analytical process. The strength of the Crust is 43kPA, and the unit weights of the three clays – Crust, Marine and Lacustrine – are 18.8kN/m3, 18.8kN/m3 and 20.3kN/m3, respectively.
In studies described in literature, Geo-Slope notes, the design analysis considers the critical mode of failure to be a circular slip surface extending to the Glacial Till, though with different potential positions in consideration of the variability in the top of the Till. The factor of safety, for SLOPE/W and computed previously by others in studies, is around 1.46.
Modelling
SLOPE/W employs Monte Carlo analysis involving numerically sampling the statistical variables many times. Sampling can be controlled by either including or excluding spatial variability.
Probabilistic studies show the importance of including spatial variability in an analysis – especially in a case such as the James Bay dyke, which has a relatively long potential slip surface, most notably in the Lacustrine Clay. Inclusion or not of spatial variability also affects the calculated probability of failure – the highest resulting from no consideration given to the parameter.
As a further aspect of the approach to use of spatial variability in the analysis, SLOPE/W can help to rapidly assess the appropriate sampling distance in the field. Geo-Slope notes that there is seldom enough data to formally evaluate the intervals and, consequently, intuitive judgment and experience become more heavily relied upon.
Including geometric variability into models can be complicated, and may require restricted implementation for general use in any project which could led to confusion and, perhaps, meaningless results. Probabilistic distributions can be assigned to point coordinates, and analysis then undertaken on a number of slip surfaces nearest what, deterministically, is viewed to be the critical slip surface.
Geo-Slope says that, SLOPE/W does not, perhaps, accommodate all the nuances and refinements possible in a probabilistic stability analysis, but would prove adequate in practice as the approach is not yet routine. However, given the latter point, it adds that the use of the software shouldn’t be made too complicated, at this stage, though such complexities can be advanced as probabilistic analyses mature.
It adds that a problem set up for deterministic analysis requires little extra modelling to undertake a probabilistic analysis. Further, though, while SLOPE/W doesn’t have capability for plotting parameters, such as strength along the slip surface to undertake Monte Carlo runs, it is a feature that could potentially be added.