

After more than 30 years of reliable operation, the Clyde hydropower plant in New Zealand identified stator–rotor air gap (AG) variation as a potential risk to generator performance and reliability. Even small deviations in the AG can result in uneven electromagnetic forces, leading to increased vibration, higher bearing loads, and accelerated component wear. To address this, an AG monitoring solution was integrated into the plant’s existing condition monitoring system, enabling direct measurement of eccentricity and providing earlier and more reliable fault detection.
Clyde and Roxburgh hydropower plants
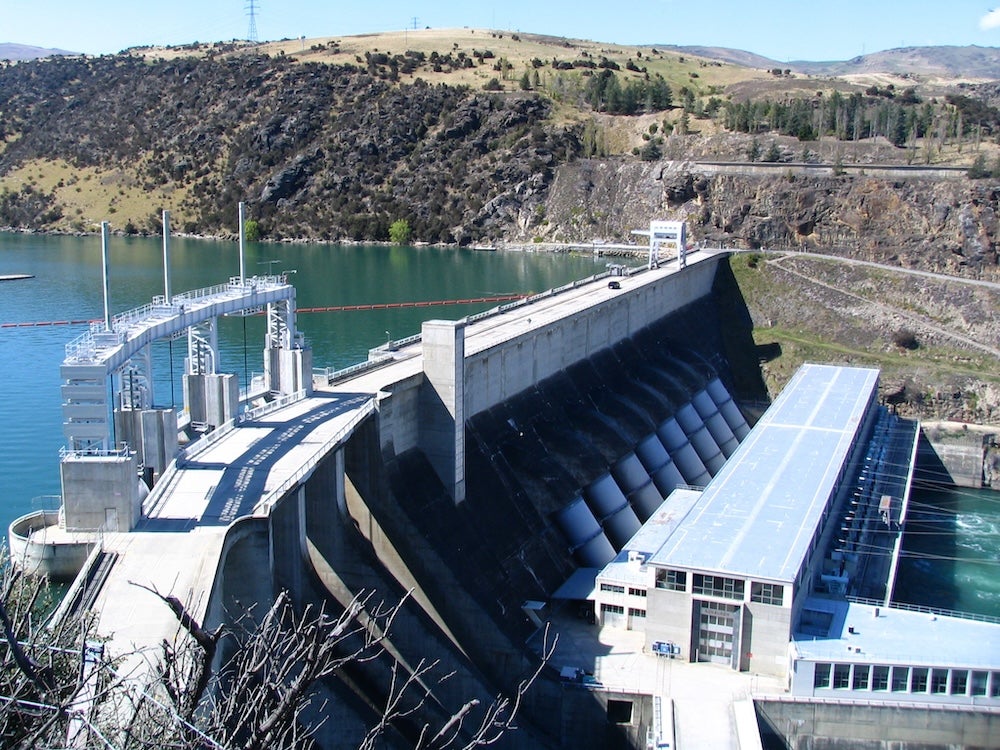
The Clyde hydropower plant is located on the Clutha River (Mata-Au) on the South Island in New Zealand. Commissioned in 1993, it is currently the third largest hydroelectric plant in NZ with 4 x 116 MW Francis turbines. Two additional penstocks were built in case of future expansion.
The Clyde hydropower plant is a typical concrete gravity construction, but its construction was special for several reasons:
- A slip joint was constructed in the dam to accommodate up to 2m differential movement due to a nearby fault line
- The Cromwell Gorge, upstream of Clyde, was stabilised to prevent landslides
- Over 18km of tunnels were built for drainage purposes
By contrast, the 320MW Roxburgh hydropower plant, located around 40km south of Clyde on the same river, is the oldest of the large hydroelectric dams in New Zealand. Its eight Francis turbines were commissioned between 1956 and 1962 and refurbished from 2002 to 2009. This dam is remotely run from the control centre at the Clyde power station.
Clyde and Roxburgh are both owned and operated by Contact Energy, which also has eight geothermal power stations, two peaking thermal power stations and some solar/battery facilities coming. Recently Contact Energy acquired 44 smaller hydropower stations. All in all, the company, generates more than 80% of its power using renewable sources, and is the third largest supplier of electricity in New Zealand. Clyde and Roxburgh together provide about 9% of New Zealand’s electricity.
Operational challenges and maintenance approach
The hydro units at Clyde were installed and commissioned in the early 1990s. All the units operate at 125 RPM.
For Roxburgh, four of the eight Francis turbines are currently being upgraded, where Units 1, 2, and 5 are already done and Unit 8 is in progress. These 40MW units operate at 136 RPM.
Normal operating conditions for both power plants include the following:
- Base load synchronised generation
- Partial load synchronised generation with reserve
- Full load peaking
- No load synchronous condensing for grid power factor correction
Both power stations primarily operate at baseload when river flow allows, and at partial load when there are long-term dry periods without rainfall.
The two power stations have been operating satisfactorily over the years from a maintenance point of view but there have been some operation and maintenance issues that have arisen. For Clyde, there were stator-rotor eccentricity issues that could be seen by vibration. This is an important issue since this causes a variation in the stator-rotor AG, resulting in varying degrees of electromagnetic imbalance. This consequently stresses the guide bearings and other components.
The four-segment stator frame also showed signs of deformation as did the rotor rim, which results in electromagnetic imbalance with increased vibration due to variable stator-rotor AG. In addition to electromagnetic imbalance, Unit 2 at Clyde also showed signs of runner imbalance.
Other issues, again affecting the Clyde power plant, include vortex turbulence occurring during partial load operation. This can be seen by increased vibration. In this case, the stressful effects on components and loss of efficiency can be controlled by changing the load.
Predictive maintenance at both power plants is based on both machine condition monitoring as well as scheduled overhauls. The time between overhauls has been extended due to condition monitoring and experience gained over time. Several faults have already been detected and diagnosed using vibration monitoring including a case where the turbine guide bearing segments were installed upside down.
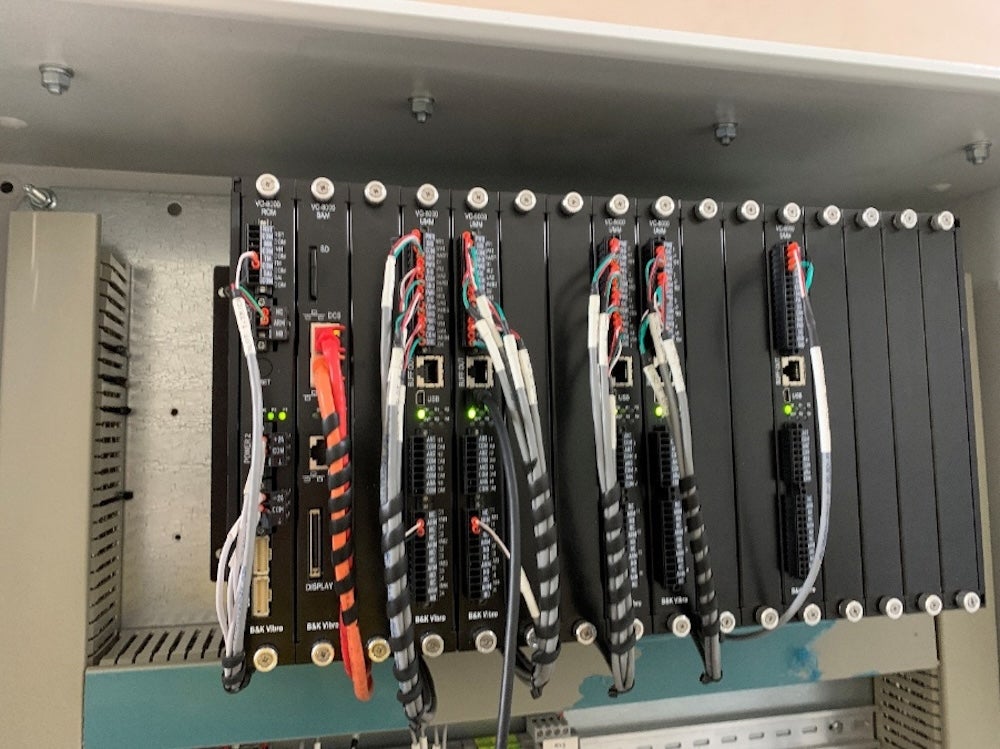
at Clyde power plant
Monitoring strategy and system integration
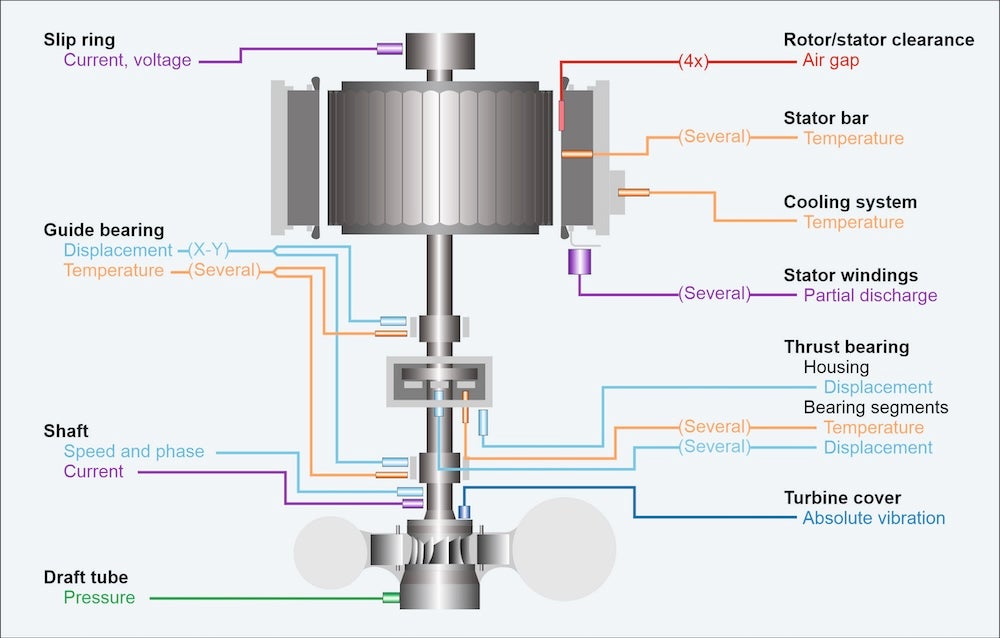
The VC-8000 SETPOINT system was already installed at Clyde in 2020 to monitor the generating unit vibration (shown in Figure 2) and is currently being installed at Roxburgh. In the case of Clyde, however, a solution was needed to specifically monitor the AG variations of the stator and the individual rotor poles, as previously mentioned. For this reason, the existing monitoring system was extended to include AG measurements, enabling direct assessment of stator deformation and rotor pole displacement—parameters that were previously inferred indirectly from vibration data. This occurred in 2025 on Unit 1 to include AG monitoring functionality, as shown in Figure 3. The AG monitoring functionality is yet to be approved for rollout to the other three units. The current comprehensive monitoring solution is also shown in Figure 3.
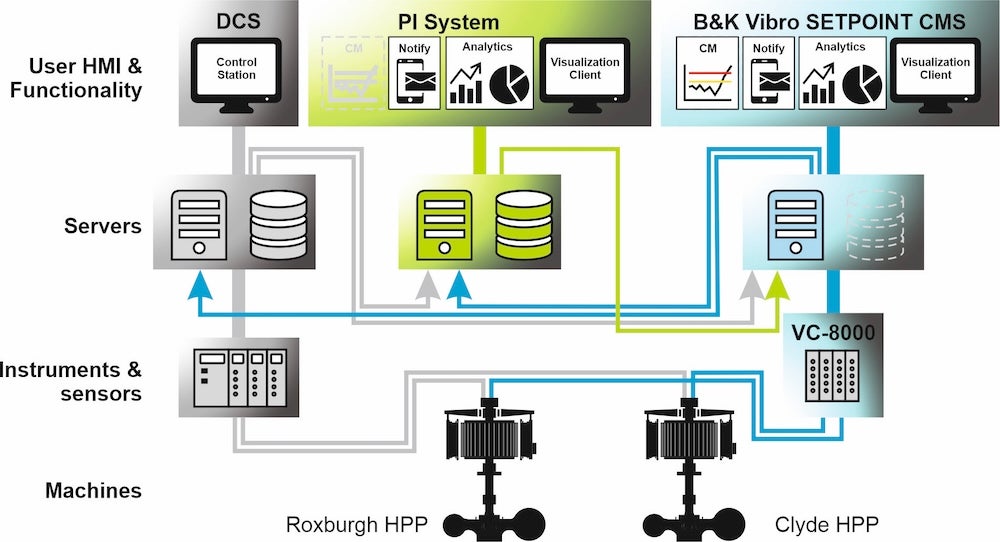
From a monitoring strategy point of view, Operators keep an eye on incoming alarms, as basic monitoring data and alarm information is sent to the DCS as shown in Figure 4. John Haakma, a local Engineer, does diagnostics on those alarms that are not resolved by the Operators, utilizing the SETPOINT system.
Remotely located Contact Energy monitoring specialists can also access this data to support John for diagnostic purposes.
The monitoring system is for both condition monitoring and protection.
AG measurement approach
AG monitoring at Clyde is based on non-contact capacitive sensors mounted on the stator inner surface. These sensors provide direct measurement of the distance between the stator and rotor, enabling continuous assessment of generator geometry during operation. Unlike vibration monitoring, which often indicates the effects of a problem, AG measurements provide direct insight into the source of generator eccentricity. This allows operators to distinguish between rotor-related issues (such as pole displacement or rim deformation) and stator-related issues (such as frame deformation or thermal effects).
There are four sensors on Unit 1 to provide sufficient spatial resolution for detecting stator deformation, while a single sensor is sufficient for identifying rotor pole displacement. By combining AG measurements with an existing phase reference signal, it is also possible to track individual rotor pole behavior and relate changes to operating conditions. This approach enables earlier detection of AG variation, improved diagnostic confidence, and more targeted maintenance planning, reducing the risk of severe events such as stator–rotor contact.
Data integration and analytics
An AVEVA PI data historian is used to store, visualize, and manage monitoring data from the plant’s condition monitoring system. The native integration with the monitoring platform enables continuous transfer of vibration, AG, and process data for centralized analysis and alarming. Beyond data storage, the PI system provides a powerful platform for advanced analytics. Parameters such as stator and rotor out-of-roundness, as well as eccentricity caused by deformation, can be calculated directly from the AG measurements. These derived values allow operators to monitor changes in generator geometry over time and set meaningful alarm limits.
In addition, process parameters such as head, flow, and electrical load can be correlated with vibration and AG data. This enables a better understanding of how operating conditions influence generator behavior, supporting more accurate diagnostics and informed maintenance decisions.
Potential failure modes that result in AG variation
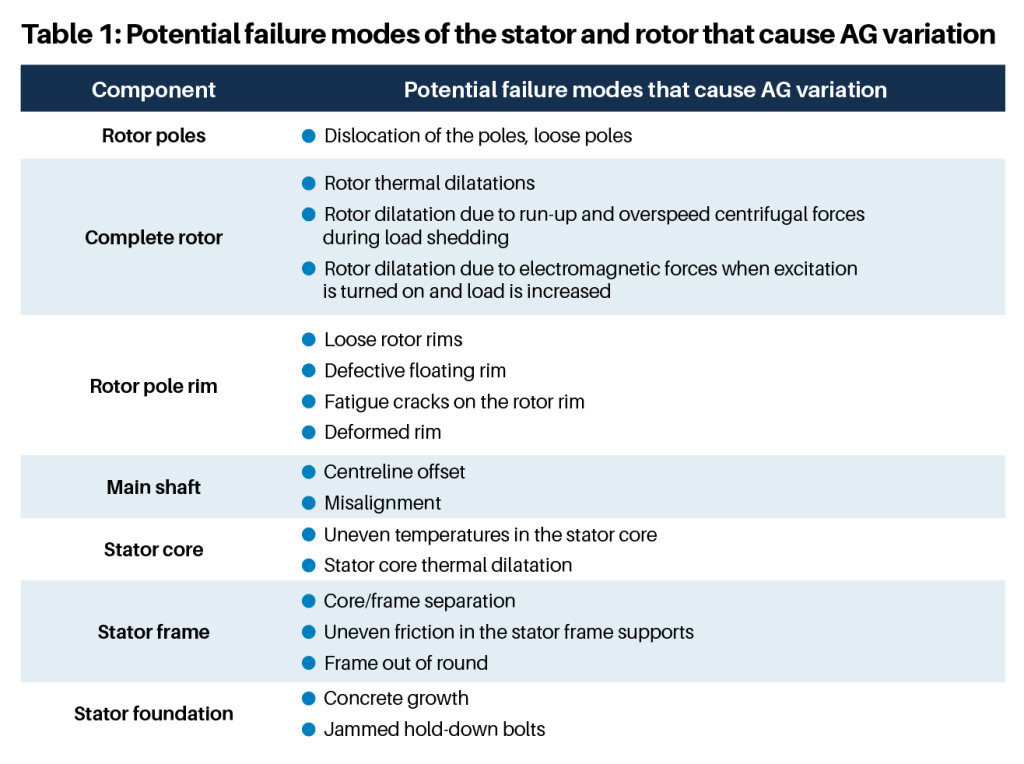
There are several faults that can be detected by monitoring AG, due to rotor pole displacement and/or stator shape change or deformation, as shown in Table 1. Although many of these potential failure modes can also be detected by vibration, the AG measurements are more accurate and provide earlier detection and more reliable diagnostic results.
Measurement techniques and plots
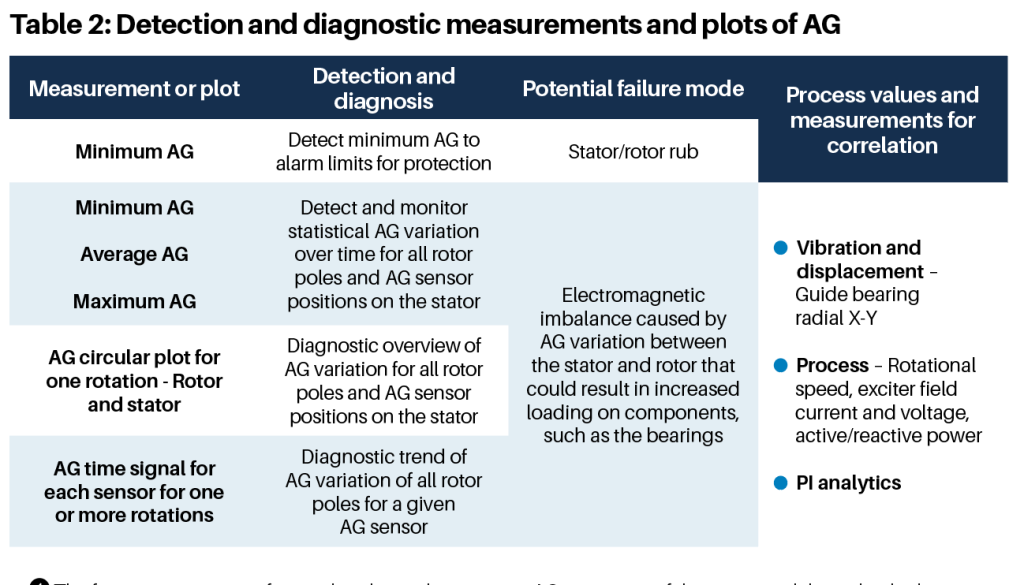
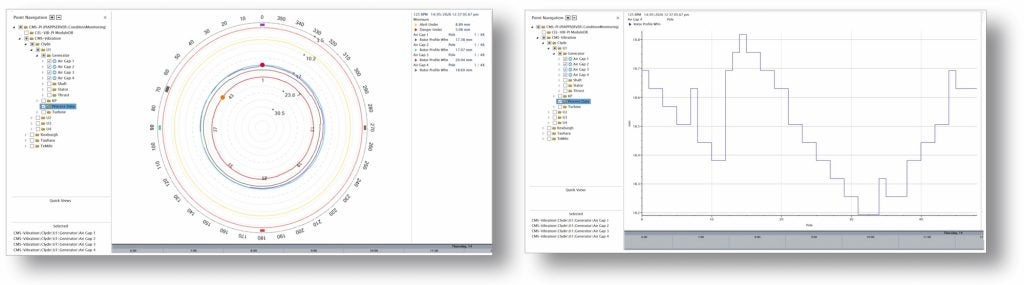
A summary of the measurements and plots used for monitoring AG at the Clyde power plant is shown in Table 2. These measurements can be monitored and displayed in plots for all operating conditions as well as in stopped and transient machine states run-up and coast-down. Examples of synchronized AG plots, which are often used for visual diagnostic analysis, are shown in Figure 5.
AG monitoring can be done in all operating conditions. This is important since some AG variations can only be seen during run-up or cost-down transient speeds.
Conclusion
Although the AG monitoring system has only recently been commissioned, it is expected to significantly improve the detection of stator and rotor deformation, allowing earlier intervention and more targeted maintenance. By providing direct measurement of AG variation, the system enhances diagnostic confidence compared to vibration-only approaches and reduces the risk of severe events such as stator–rotor contact.
As experience is gained and the system is rolled out across additional units, AG monitoring is expected to become an integral part of the plant’s reliability strategy.
Currently, Roxburgh power plant has not demonstrated any symptoms of variable AG so there are no plans to install AG monitoring capability on those units. Nevertheless, a watchful eye will be kept on these units in addition to those at Clyde.


